Zinger Key Points
- Dogecoin hasn't yet confirmed an uptrend by printing a higher low on the daily chart.
- If the crypto closes the 24-hour trading session near its high-of-day, higher prices could come on Wednesday.
- Join Chris Capre on Sunday at 1 PM ET to learn the short-term trading strategy built for chaotic, tariff-driven markets—and how to spot fast-moving setups in real time.
Dogecoin DOGE/USD skyrocketed over 10% between noon and 1 p.m. Tuesday before beginning to consolidate slightly down off the 24-hour high of $0.0665.
The sudden surge was prompted by news that Tesla, Inc TSLA CEO Elon Musk’s offer to purchase Twitter, Inc TWTR for $54.20 per share is back on the table. Musk attempted to back out of deal in July, prompting a lawsuit from Twitter, and is set to wind up in court on Oct. 17 for the trial.
Musk, a Dogecoin bull, has shown openness to integrating the Shiba Inu-based crypto onto Twitter, and if he follows through this time, and becomes owner of the social media company, Dogecoin’s utility could increase.
Technically speaking, Dogecoin looked set to trade higher because the crypto had printed a triple bottom pattern at the $0.058 mark.
A double bottom pattern is a reversal indicator that shows a stock or crypto has dropped to a key support level, rebounded, back tested the level as support and is likely to rebound again. It is possible the stock may retest the level as support again, creating a triple or even quadruple bottom pattern.
The formation is always identified after a security has dropped in price and is at the bottom of a downtrend, whereas a bearish double top pattern is always found in an uptrend. A spike in volume confirms the double bottom pattern was recognized, and subsequent increasing volume may indicate the stock will reverse into an uptrend.
- Aggressive bullish traders may choose to take a position when the stock or crypto’s volume spikes after the second retest of the support level. Conservative bullish traders may wait to take a position when the stock or crypto’s price has surpassed the level of the initial rebound (the high before the second bounce from the support level).
- Bearish traders may choose to open a short position if the stock or crypto rejects at the level of the first rebound or if the stock or crypto falls beneath the key support level at which it created the double bottom pattern.
Want direct analysis? Find me in the BZ Pro lounge! Click here for a free trial
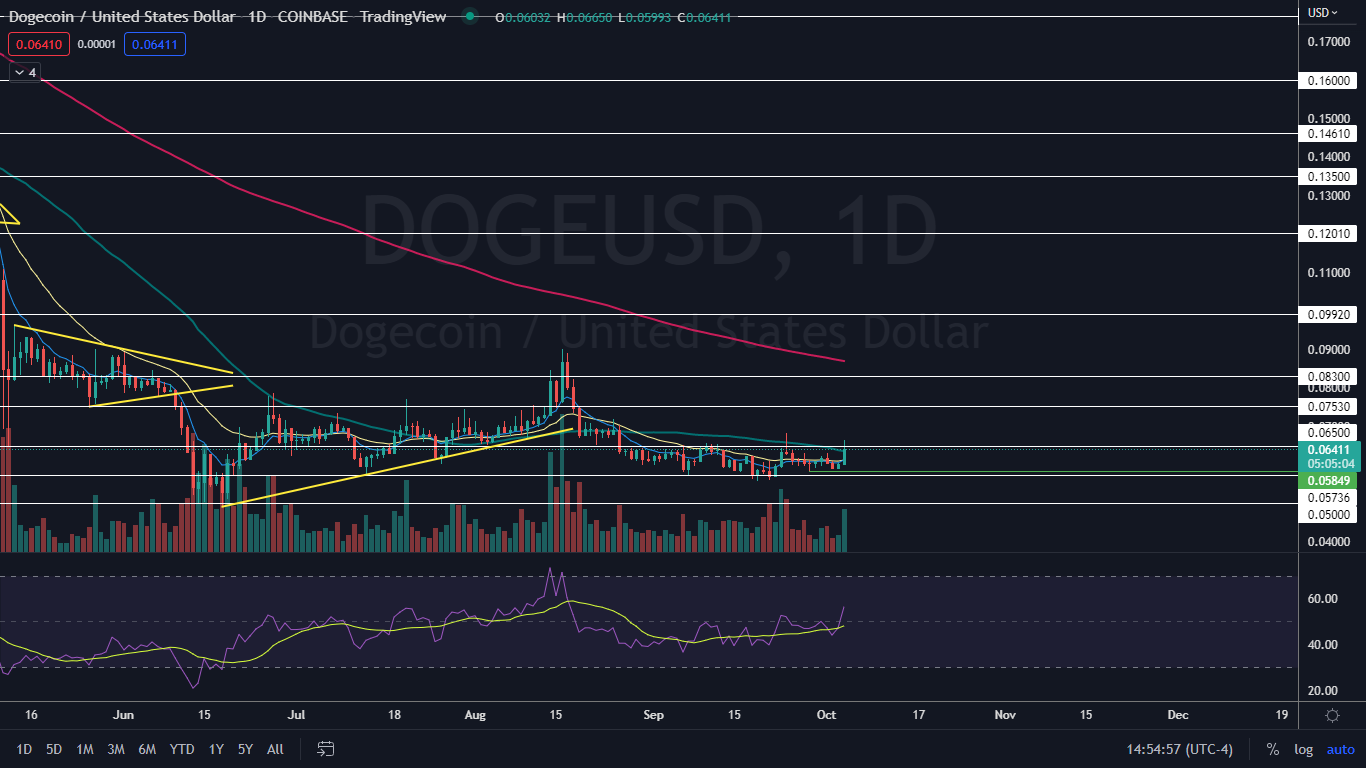
The Dogecoin Chart: Dogecoin’s triple bottom pattern was printed on Sept. 28, Oct. 2 and Oct. 3 at the $0.058 level. On Tuesday, prompted by the news, Dogecoin began to react bullishly to the pattern, surging above the eight-day and 21-day exponential moving averages (EMAs) and the 50-day simple moving average.
- If Dogecoin is able to close the trading day above the three moving averages, the eight-day EMA will quickly cross above the 21-day, which would give bullish traders more confidence going forward.
- Dogecoin isn’t trading in a confirmed uptrend or a downtrend on the daily chart. When Dogecoin spiked higher on Tuesday, it negated a short-term downtrend.
- If an uptrend is in the cards, Dogecoin will need to retrace lower to print a higher low above the $0.058 level over the coming days.
- The crypto’s volume is measuring in at above average, which indicates a high level of interest has returned and is good news for the bulls. As of Tuesday afternoon, Dogecoin’s volume was registering in at about 360 million on Coinbase compared to the 10-day average of about 263 million.
- If Dogecoin closes the trading day near its high-of-day price, the crypto will print a bullish Marubozu candlestick, which could indicate higher prices are in the cards. If the crypto closes the 24-hour trading session with a long upper wick, lower prices or sideways consolidation is the most likely scenario.
- Dogecoin has resistance above at $0.065 and $0.075 and support below at $0.057 and at the 5-cent mark.
Photo via Shutterstock.
Edge Rankings
Price Trend
© 2025 Benzinga.com. Benzinga does not provide investment advice. All rights reserved.
Trade confidently with insights and alerts from analyst ratings, free reports and breaking news that affects the stocks you care about.
 See Also: