Zinger Key Points
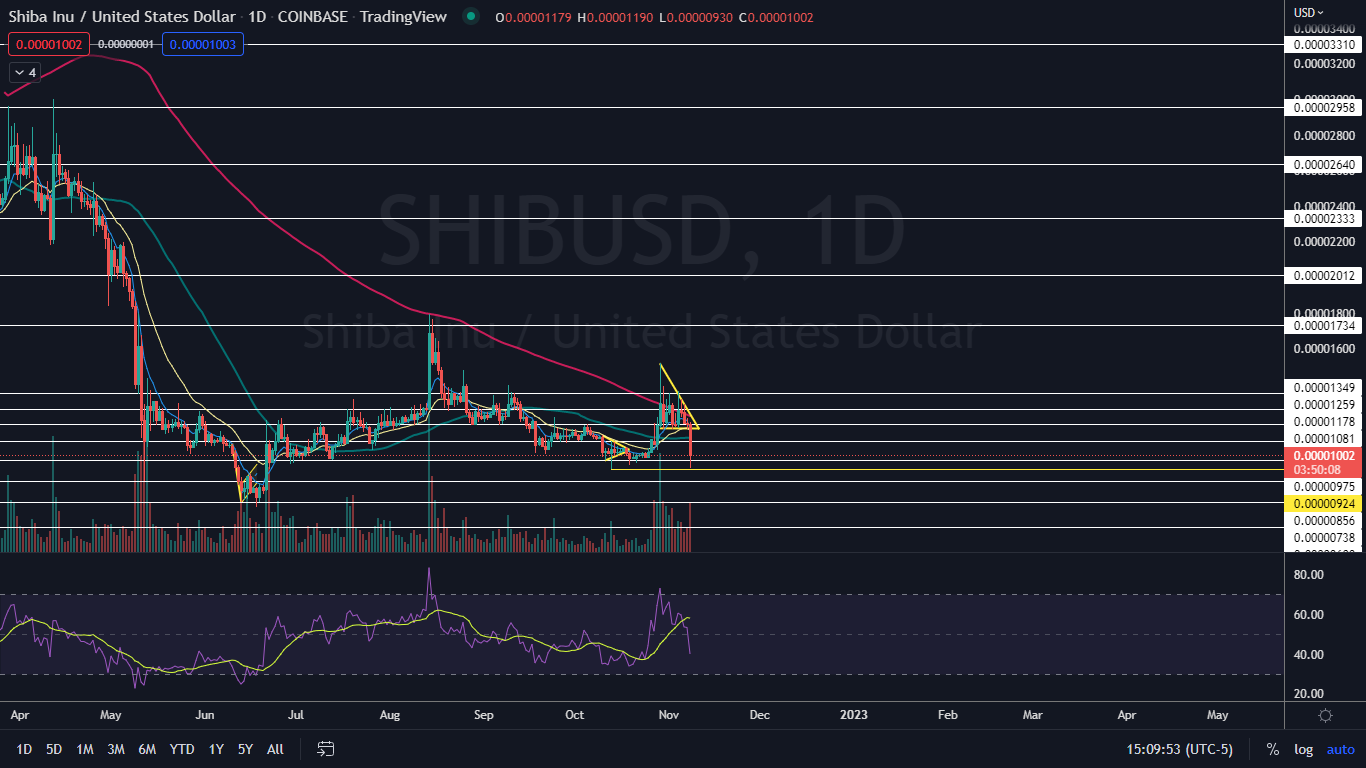
- Shiba Inu broke down from a descending triangle pattern after failing to regain the 200-day SMA as support.
- When the crypto reached its low-of-day, it formed a bullish double bottom pattern just under the $0.00001 level.
- Get Real-Time News and Alerts for Your Portfolio
Shiba Inu SHIB/USD was plunging over 20% at one point Tuesday afternoon, in tandem with the broader crypto sector, which is seeing high levels of volatility in Bitcoin BTC/USD and Ethereum ETH/USD.
Dogecoin DOGE/USD sank almost 30% before bouncing up off the 200-day simple moving average (SMA).
Between 9 p.m. and midnight on Monday, Bitcoin slid 5%. Bulls came in and bought the dip on Tuesday morning, causing the apex crypto to surge 7.5% before massive selling pressure entered after noon, dropping Bitcoin down almost 15% from Monday’s closing price.
Bitcoin then bounced up off a solid support level near $17,580, which Benzinga pointed out earlier on Tuesday. The rebound caused Shiba Inu to jump up from the $0.00000930 low-of-day.
Shiba Inu’s plummet caused the crypto to break down from a descending triangle pattern on the daily chart, which is the most likely scenario when that formation appears.
The “Dogecoin Killer” developed the pattern just under the 200-day simple moving average beginning Oct. 29, which indicated that bullish traders were struggling to turn the sentiment in the crypto.
The 200-day SMA is an important bellwether. Technical traders and investors consider a stock trading above the level on the daily chart to be in a bull cycle, whereas a stock trading under the 200-day SMA is considered to be in a bear cycle.
The 50-day SMA also plays an important role in technical analysis, especially when paired with the 200-day. When the 50-day SMA crosses below the 200-day SMA, a death cross occurs. When the 50-day SMA crosses above the 200-day, a bullish golden cross takes place.
Want direct analysis? Find me in the BZ Pro lounge! Click here for a free trial.
The Shiba Inu Chart: Shiba Inu faced a hard rejection from the 200-day SMA multiple times, fell back into the descending triangle pattern and broke down bearishly. The plummet caused the crypto to hit the Oct. 13 low-of-day, which acted as support and created a bullish double bottom pattern.
- After creating the double bottom pattern, bulls came in and bought the dip, causing Shiba Inu to surge over 8% up from the low-of-day.
- If the crypto can close Tuesday’s 24-hour trading session with a substantial lower wick, Shiba Inu will print a hammer candlestick, which could indicate a further bounce is in the cards for Wednesday.
- If Shiba Inu closes the trading session near the low-of-day, the crypto will print a bearish Marubozu candlestick, which could indicate lower prices are in the cards. Eventually the crypto will need to enter into a sideways consolidation pattern on decreasing volume to digest Tuesday’s high levels of volatility.
- Shiba Inu’s plunge during Tuesday’s session occurred on higher-than-average volume, which is a potential warning sign for the bulls. As of Tuesday afternoon, Shiba Inu’s volume on Coinbase COIN was measuring in at about 6.2 trillion compared to the 10-day average of 4.33 trillion.
- Shiba Inu has resistance above at $0.00001081 and $0.00001178 and support below at $0.00000975 and $0.00000924.
 See Also: What In The World Is Going On With Bitcoin-Related Stock MicroStrategy (MSTR)
Photo via Shutterstock.
© 2025 Benzinga.com. Benzinga does not provide investment advice. All rights reserved.
Trade confidently with insights and alerts from analyst ratings, free reports and breaking news that affects the stocks you care about.