Zinger Key Points
- Bitcoin has been consolidating sideways after regaining the 200-day SMA on Friday.
- The consolidation is needed because Bitcoin's RSI is trending in overbought territory.
- Feel unsure about the market’s next move? Copy trade alerts from Matt Maley—a Wall Street veteran who consistently finds profits in volatile markets. Claim your 7-day free trial now.
After coming close to tagging the 200-day simple moving average on Friday afternoon, Bitcoin BTC/USD flew through the area later during the 24-hour trading session, following Dogecoin and Ethereum, which Benzinga called out.
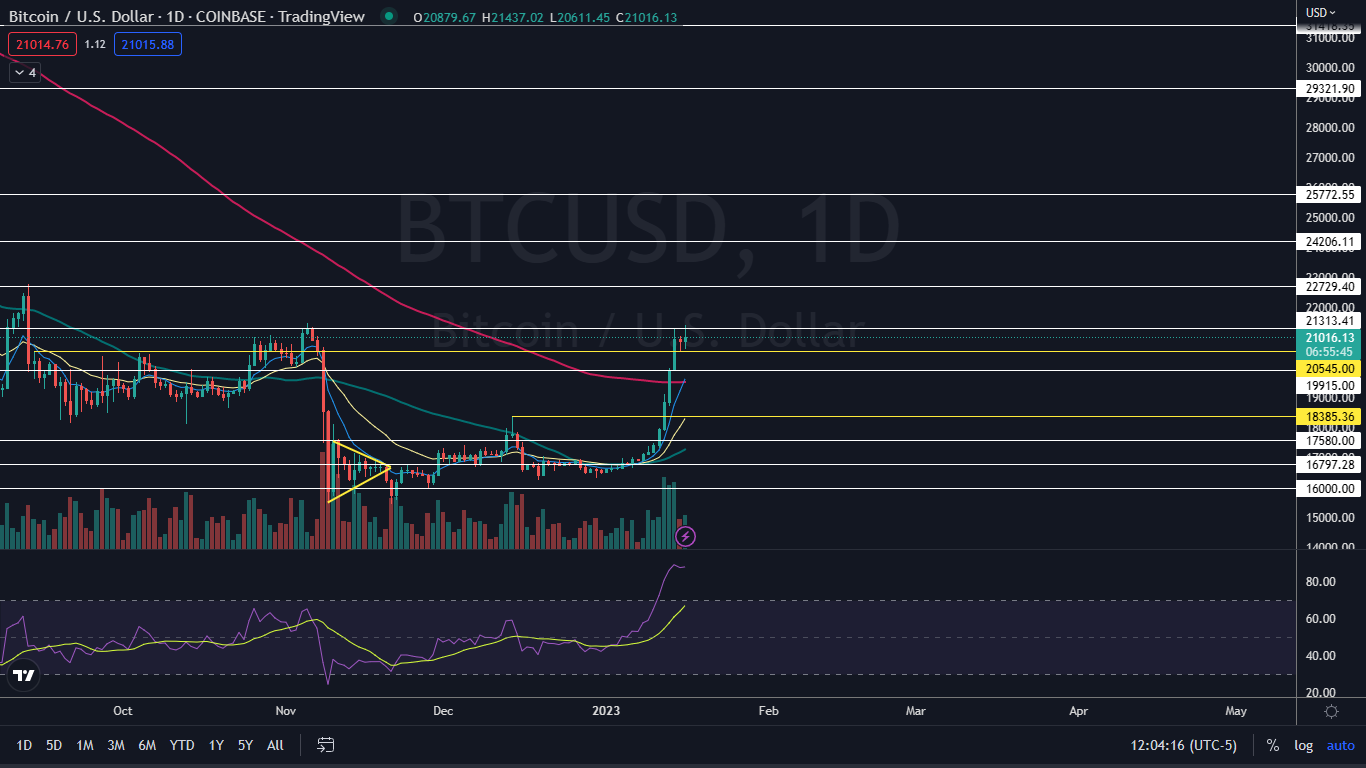
After busting up through the bellwether indicator, Bitcoin surged over 9% higher over Friday night and Saturday to top out at $21,321.98 that day, before entering into a period of sideways consolidation.
The general market and crypto sector have been trading in an upward trajectory since in-line CPI data was released by the U.S. Labor Department, which gave traders and investors hope the Federal Reserve may successfully drop inflation without throwing the U.S. into a recession.
Want direct analysis? Find me in the BZ Pro lounge! Click here for a free trial.
Since Sunday, Bitcoin has been trading mostly sideways between about $20,500 and $21,500 to consolidate the recent surge, which is a positive sign.
The Bitcoin Chart: Bitcoin started trading in an uptrend on Dec. 30 and had since printed a few higher highs and higher lows on the daily chart. The most recent higher low was formed on Jan. 6 at $16,670 and the most recent confirmed higher high was printed on that same day at $17.027.
- During Sunday’s 24-hour trading session, the crypto printed an inside bar on the daily chart, which leans bullish because Bitcoin was trading higher prior to forming the pattern. On Monday, Bitcoin attempted to break up from the inside bar but couldn’t gain momentum, likely because the crypto needs further consolidation.
- Consolidation is needed because Bitcoin’s relative strength index (RSI) is measuring at almost 89%. When a stock’s or crypto’s RSI reaches or exceeds the 70% mark, it becomes overbought, which can be a sell signal for technical traders.
- Bullish traders want to see continued sideways or slightly downwards consolidation so that Bitcoin’s RSI drops down to a more comfortable level and then for big bullish volume to come in and break the crypto up above Saturday’s high-of-day. Bearish traders may choose to scalp the upper range of the sideways pattern or wait for signs that the current bull run has come to an end.
- Bitcoin has resistance above $21,313.41 and $22,729.40 and support below at $20,545 and $19,915.
Edge Rankings
Price Trend
© 2025 Benzinga.com. Benzinga does not provide investment advice. All rights reserved.
Trade confidently with insights and alerts from analyst ratings, free reports and breaking news that affects the stocks you care about.
 Read Next: