Zinger Key Points
- Bitcoin and Ethereum continue lower in downtrends Friday, while Dogecoin was printing an inside bar.
- All three cryptos are likely to find support at the 200-day SMA if they continue to fall lower over the weekend.
- Today's manic market swings are creating the perfect setup for Matt’s next volatility trade. Get his next trade alert for free, right here.
Bitcoin BTC/USD and Ethereum ETH/USD were sliding slightly during Friday’s 24-hour trading session, in tandem with the general market, which saw the S&P 500 struggling to hold near to Thursday’s closing price.
Dogecoin DOGE/USD was showing relative strength, popping up slightly in an attempt to regain the 50-day simple moving average (SMA) as support.
All three cryptos suffered bearish price action during Thursday’s 24-hour trading session, with Bitcoin, Ethereum and Dogecoin plunging over 5%, 6% and 9%, respectively, as fears the rising U.S. dollar could be signaling a recession gripped investors.
Consumer price index data for January is set to be released by the Labour Department on Tuesday and traders and investors will be watching closely to see if the Federal Reserve is doing enough to lower inflation.
Until then, the market and crypto sector are likely to remain choppy, with traders and investors apprehensive over what the data may show.
Want direct analysis? Find me in the BZ Pro lounge! Click here for a free trial.
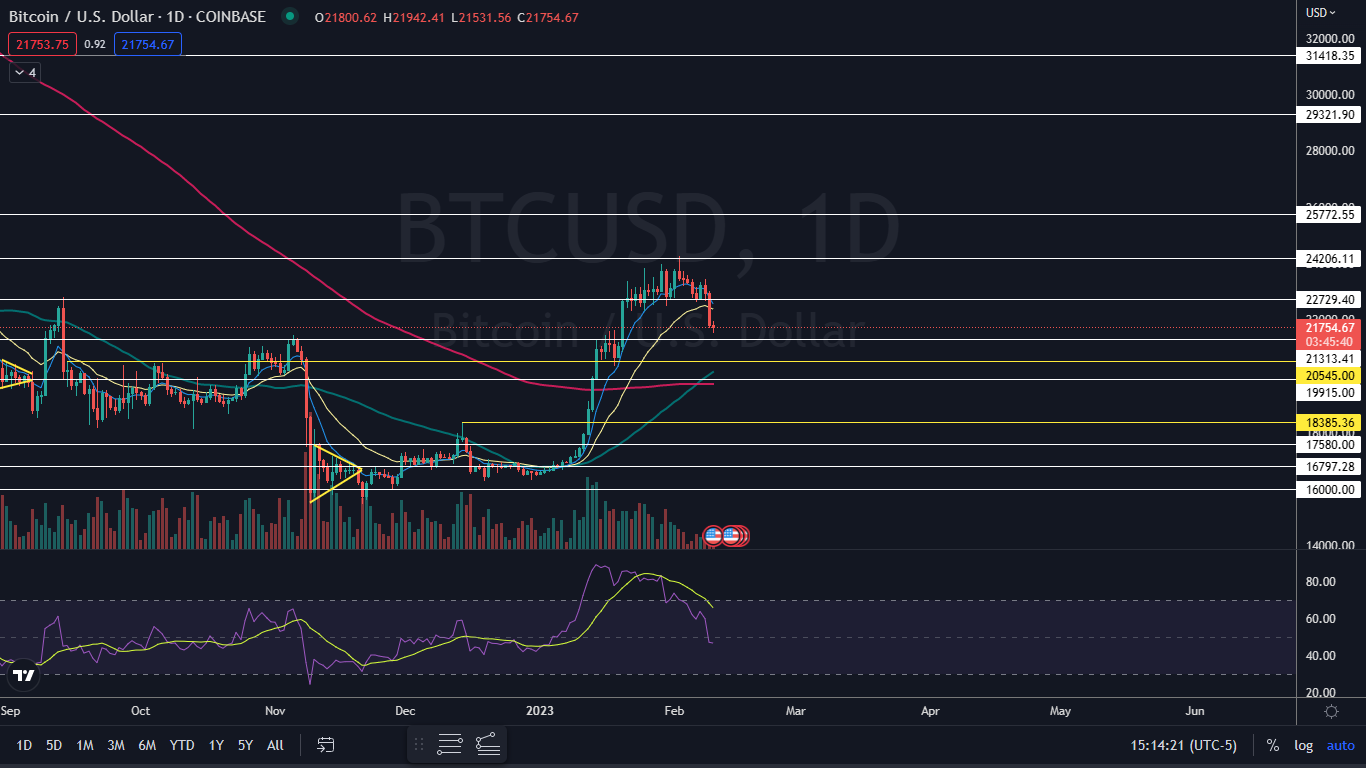
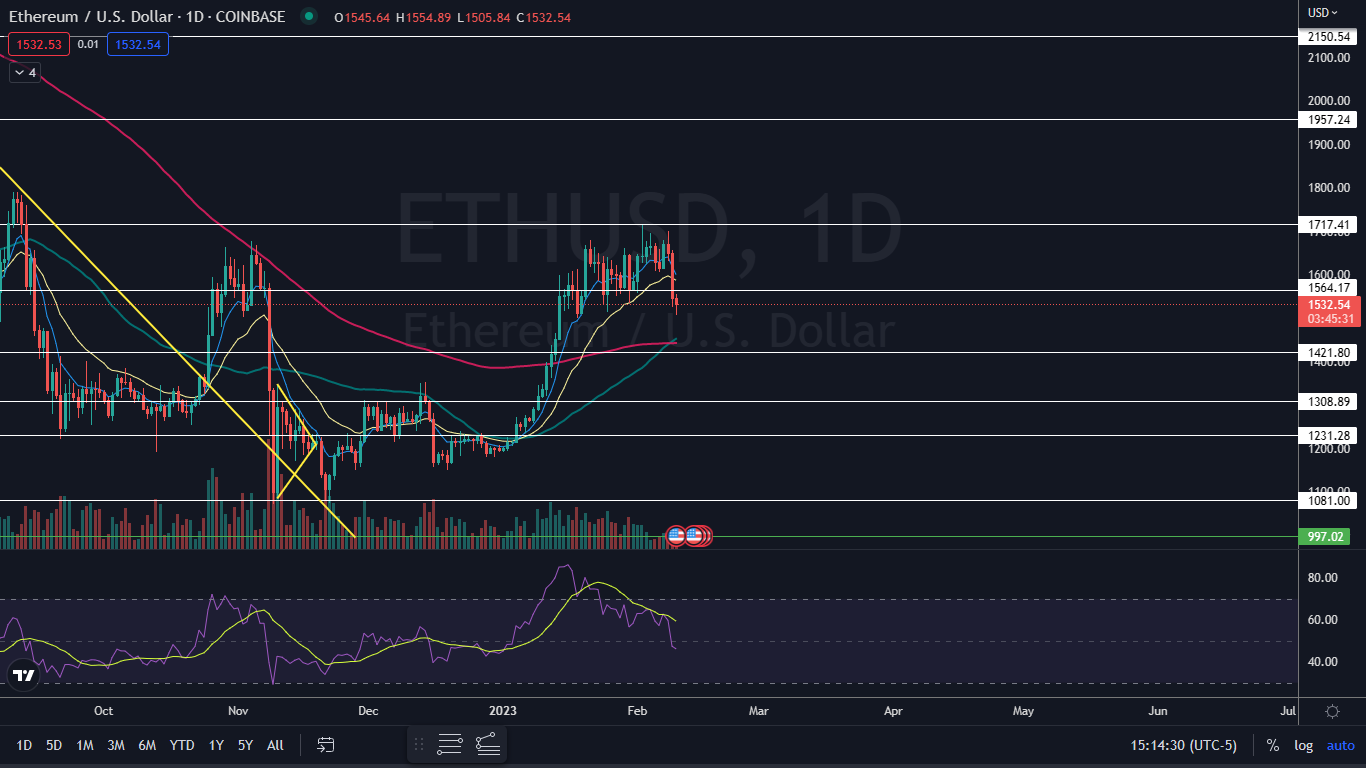
The Bitcoin and Ethereum Charts: Bitcoin and Ethereum negated their uptrends on Wednesday by printing lower highs and on Thursday confirmed downtrends by forming lower lows. Bitcoin’s most recent lower high is at the $23,451 mark and Ethereum’s is at $1,699.
Neither Bitcoin nor Ethereum has shown evidence that their next lower lows have occurred and traders and investors will be watching to see if the cryptos show any reversal signals into the weekend. If Bitcoin and Ethereum close Friday’s session flat or at their high-of-day, they will print a doji or hammer candlestick, respectively, which could indicate a bounce will come on Saturday.
A golden cross formed on Bitcoin’s and Ethereum’s chart this week, which may give bullish traders more confidence going forward. A golden cross occurs when the 50-day simple moving average (SMA) crosses above the 200-day SMA and those levels may provide support if Bitcoin and Ethereum continue to fall further.
Bitcoin has resistance above at $22,729 and $24,206 and support below at $21,313 and $20,545.

Ethereum has resistance above at $1,564 and $1,717 and support below at $1,421.

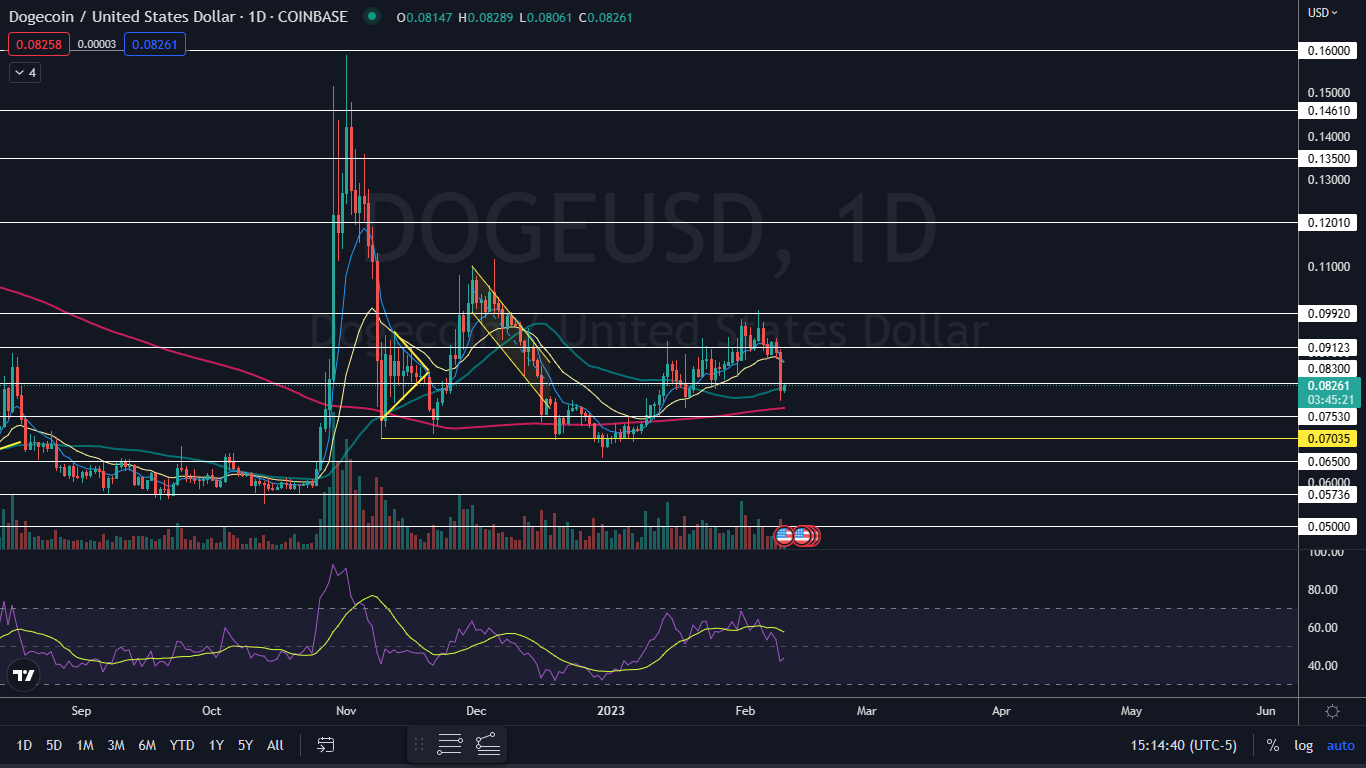
The Dogecoin Chart: Like Bitcoin and Ethereum, Dogecoin confirmed a new downtrend on Thursday by printing falling under its most recent higher low after printing a lower high. Dogecoin’s most recent lower high was created on Wednesday at $0.093.
During Friday’s 24-hour trading session, Dogecoin was trading in an inside bar pattern, with all of the price action taking place within Thursday’s range. The pattern leans bearish in this case because Dogecoin is in a downtrend and because the inside bar was forming at the bottom of Thursday’s trading range.
Traders and investors can watch for Dogecoin to break up or down from the mother bar later on Friday or over the weekend to gauge future direction, otherwise, the crypto may continue to chop sideways. If Dogecoin breaks bearishly, the crypto is likely to find support at the 200-day SMA.
Dogecoin has resistance above at $0.083 and $0.091 and support below at $0.075 and at the 7-cent mark.

Read Next: If You Invested $100 In Dogecoin When The Meme Coin Launched, Here's How Much You'd Have Now
Photo: Jiri Hera via Shutterstock
Edge Rankings
Price Trend
© 2025 Benzinga.com. Benzinga does not provide investment advice. All rights reserved.
Trade confidently with insights and alerts from analyst ratings, free reports and breaking news that affects the stocks you care about.