Bitcoin BTC/USD was popping up about 1% during Friday’s 24-hour trading session, which was helping pull Ethereum ETH/USD up by about the same amount, despite an initial downturn.
The moves higher were comparatively weaker than in the general market, which saw the S&P 500 rising about 0.5% at one point after mixed jobs data was released by the U.S. Labor Department.
Dogecoin DOGE/USD was also popping about 1% higher, in tandem with the apex cryptocurrencies. The market is anticipating the Federal Reserve will resume raising interest rates when it meets later this month, which could be bullish for the crypto sector and possibly bearish for the stock market.
The three cryptos have been consolidating mostly sideways on lower-than-average volume, which suggests a big move in one direction could be on the horizon. Until then, the low volumes suggest traders are sitting on the sidelines, waiting to take a position until the future direction is determined.
Want direct analysis? Find me in the BZ Pro lounge! Click here for a free trial.
The Bitcoin and Ethereum Charts: Bitcoin and Ethereum have been trading sideways since June 22, after rising significantly between June 15 and June 21, when the cryptos bounced up from near the 200-day simple moving average. Bitcoin topped out near the $31,500 mark and Ethereum near $2,000.
Although there have been single-day volume spikes, volume has been declining overall in the cryptos, which indicates a low level of interest. Decreasing volume is often followed by a surge in volume, which will eventually help to determine if Bitcoin and Ethereum will continue their bullish cycles or if a downturn is in the cards.
Bitcoin has resistance above at $31,418 and $35,593 and support below at $30,050 and $28,690.

Ethereum has resistance above at $1,937 and $2,150 and support below at $1,825 and $1,717.

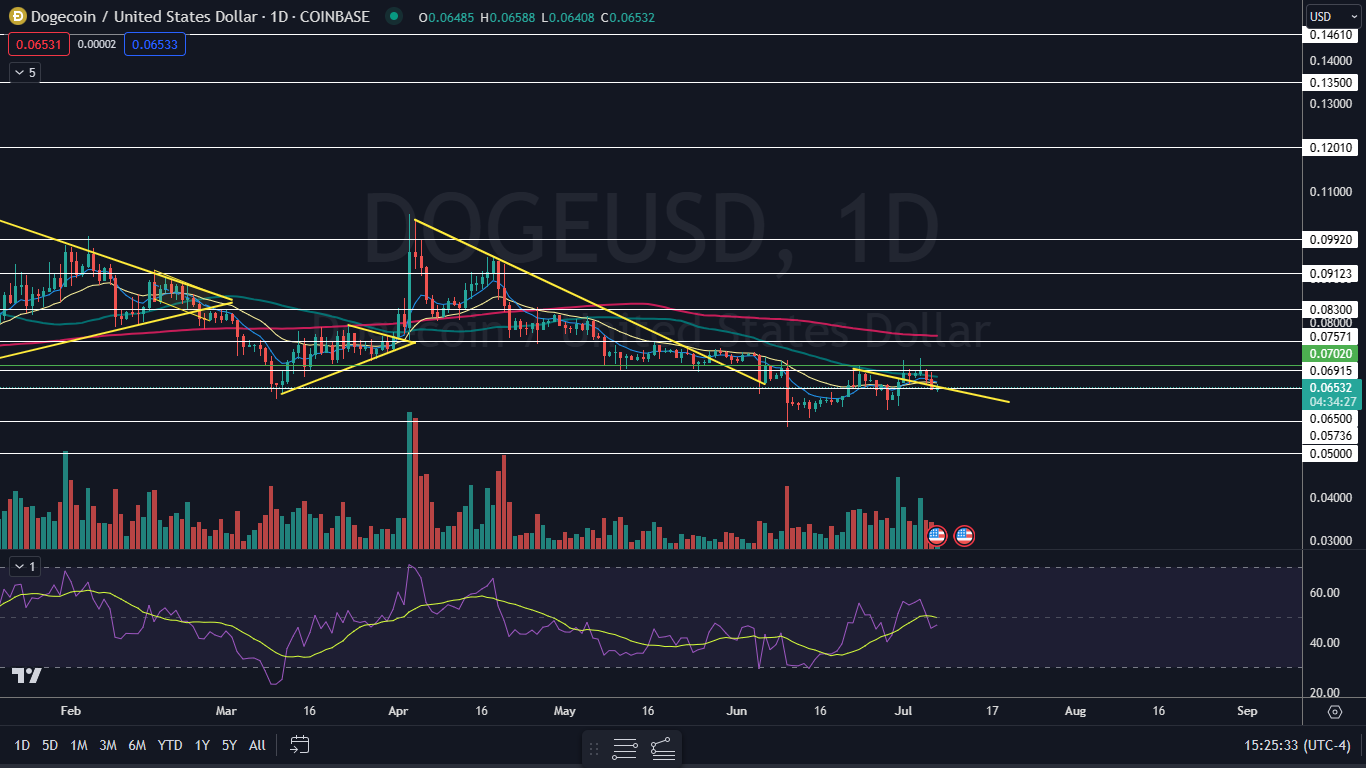
The Dogecoin Chart: Like Bitcoin and Ethereum, Dogecoin has been trading mostly sideways but holding above a descending trend line, which the crypto broke up from on July 1. Dogecoin is trading under the 200-day simple moving average declining volume, which indicates consolidation.
Bullish traders want to see big bullish volume come in and drive Dogecoin up above the 200-day SMA, which could indicate a longer-term bull cycle is on the horizon. Bearish traders want to see the crypto break down under the descending trend line, which could continue to push the crypto lower.
Dogecoin has resistance above at $0.069 and $0.075 and support below at $0.065 and $0.057.

Read Next: Benzinga's Stock Whisper Index: 5 Tickers Investors Secretly Monitor But Don't Talk About... Yet
Photo: Shutterstock
© 2025 Benzinga.com. Benzinga does not provide investment advice. All rights reserved.
Comments
Trade confidently with insights and alerts from analyst ratings, free reports and breaking news that affects the stocks you care about.