Zinger Key Points
- Bitcoin was spiking up higher during Friday's session, attempting to regain the $30,000 level.
- While Bitcoin broke up from an inside bar pattern, Ethereum and Dogecoin are stuck in symmetrical triangle patterns.
- Find out which stock just plummeted to the bottom of the new Benzinga Rankings. Updated daily—spot the biggest red flags before it’s too late.
Bitcoin BTC/USD was leading the crypto sector higher during Friday’s 24-hour trading session amid optimism that the approval of a spot Bitcoin ETF is on the horizon.
BlackRock and Fidelity introduced changes to their spot Bitcoin ETF submissions at the beginning of the week, while Grayscale filed an S-3 application as part of its efforts to secure similar approvals.
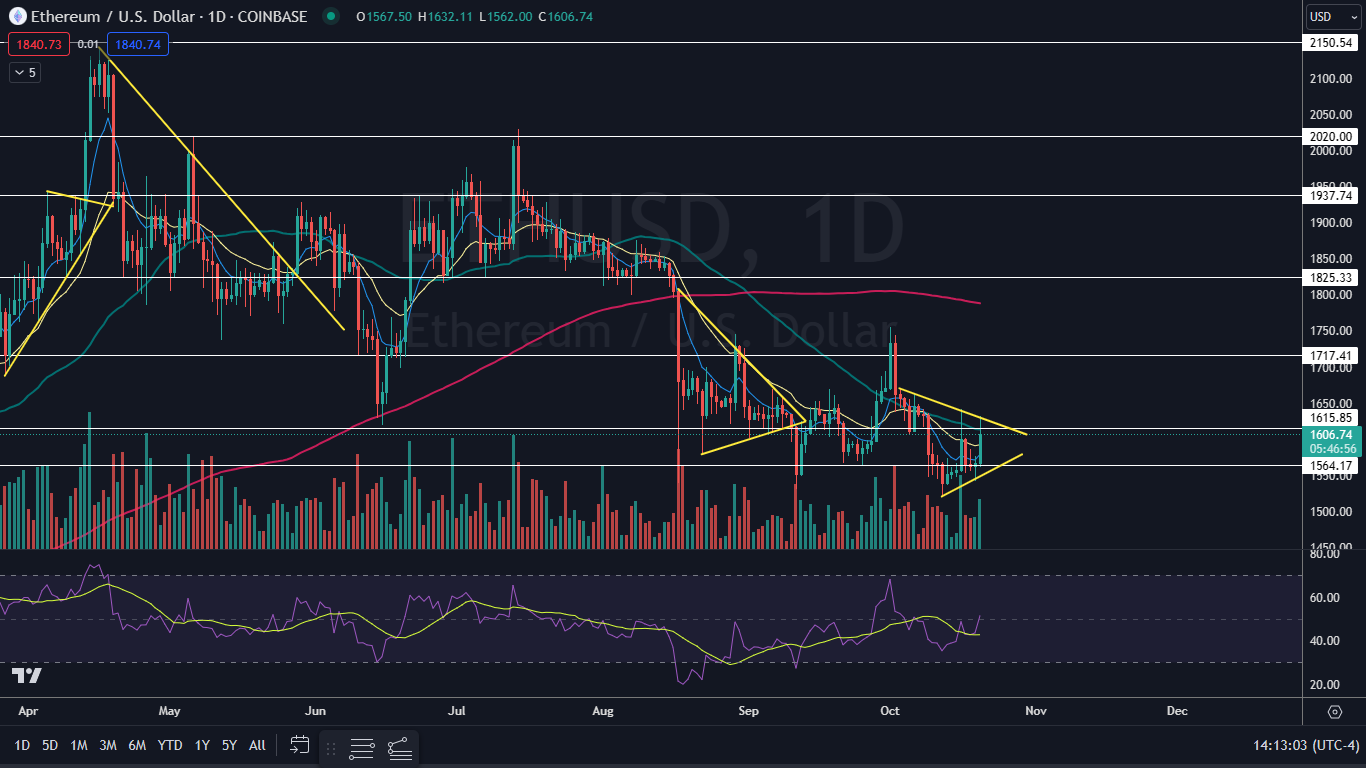
From a technical analysis perspective, Bitcoin was attempting to break up from a triple inside bar pattern. Ethereum and Dogecoin were unable to break up above their Oct. 16 high, causing the cryptos to remain trading in symmetrical triangle patterns.
A symmetrical triangle pattern is created when a stock forms a series of lower highs and higher lows between a descending and an ascending trendline, which meet on the right side of the chart to form an apex. The pattern indicates that the bulls and bears are equally in control.
A symmetrical triangle is often formed on lower-than-average volume and demonstrates a decrease in volatility, indicating consolidation. The decreasing volume is often followed by a sharp increase in volume when the stock breaks up or down from the pattern, which should happen before the stock reaches the apex of the triangle.
Want direct analysis? Find me in the BZ Pro lounge! Click here for a free trial.
The Bitcoin Chart: For the last three trading days, Bitcoin’s trading range has taken place within the Oct. 16 mother bar, which settled the crypto into a triple inside bar pattern. The pattern leans bullish for continuation because Bitcoin has been trading in a strong uptrend.
During Friday’s trading session, Bitcoin temporarily broke above the top of the mother bar but ran into a group of sellers near $30,000, which caused a retracement. The spike caused Bitcoin to form another higher high, however, which confirmed the uptrend remains intact.
When Bitcoin surged on Oct. 16, the crypto regained support at the 200-day simple moving average (SMA), which indicates Bitcoin is trading in a bull cycle. If Bitcoin can remain above the 200-day SMA for a period of time, the 50-day SMA will cross above the 200-day, which would cause a golden cross to form.
A loss of the 200-day SMA on big bearish volume could be an exit signal for bullish traders holding a position.
Bitcoin has resistance above at $30,050 and at $31,418 and support below at $28,690 and at $27,133.
 The Ethereum and Dogecoin Charts: Ethereum and Dogecoin began trading in symmetrical triangle patterns on Oct. 3 and Oct. 2, respectively. The patterns lean bearish in this case but the upward trajectory of Bitcoin may cause Ethereum and Dogecoin to break bullishly from the formation.,
Ethereum and Dogecoin have both been making a series of higher lows and lower highs as their trading range tightens. When the cryptos attempted to break up from the triangles, Ethereum and Dogecoin both rejected the 50-day SMA, indicating the cryptos are trading in bear cycles.
Bullish traders want to see Ethereum and Dogecoin regain the 50-day SMA as support, which will also cause the cryptos to break up from their triangles. Bearish traders want to see big bearish volume come in and cause the cryptos to break down from the triangles, which will throw Ethereum and Dogecoin into downtrends.
Ethereum has resistance above at $1,615 and at $1,717 and support below at $1,564 and at $1,421.
 Dogecoin has resistance above at $0.061 and at $0.065 and support below at $0. 057 and at $0.055.
 Find out what the experts have to say on the evolving crypto space. Meet and engage with other transformative Digital Asset and Crypto business leaders and investors at Benzinga's exclusive event: Future of Digital Assets. Tickets are flying: Get yours!
Read Next: Meet Web3 Trendsetter William E. Quigley At Benzinga's Future Of Digital Assets Event
Photo: Shutterstock
© 2025 Benzinga.com. Benzinga does not provide investment advice. All rights reserved.
Trade confidently with insights and alerts from analyst ratings, free reports and breaking news that affects the stocks you care about.