Zinger Key Points
- Bitcoin has settled into a possible bull flag pattern, with a measured move of about 20%.
- Ethereum and Dogecoin are trading in strong uptrends, making higher highs and higher lows.
- Feel unsure about the market’s next move? Copy trade alerts from Matt Maley—a Wall Street veteran who consistently finds profits in volatile markets. Claim your 7-day free trial now.
Bitcoin BTC/USD was trading slightly higher during Friday’s 24-hour trading session, ahead of the U.S. Securities and Exchange Commission's expected approval of the first spot Bitcoin ETFs at the start of the new year.
Ethereum ETH/USD was holding relatively flat heading into the weekend, while Dogecoin DOGE/USD was gaining some momentum to the upside, hovering slightly above Thursday’s closing price.
The crypto sector has enjoyed a strong rally during the fourth quarter, with Bitcoin surging about 62% since the Sept. 30 closing price. Similarly, Ethereum has risen about 41% and Dogecoin has gained 58% so far during the last quarter of 2023.
The run higher may not be over heading into the last few weeks of the year because Bitcoin, Ethereum and Dogecoin are flashing bullish technical signals on their respective charts, with the apex crypto forming a bull flag pattern and Ethereum and Dogecoin trading in strong uptrends.
Want direct analysis? Find me in the BZ Pro lounge! Click here for a free trial.
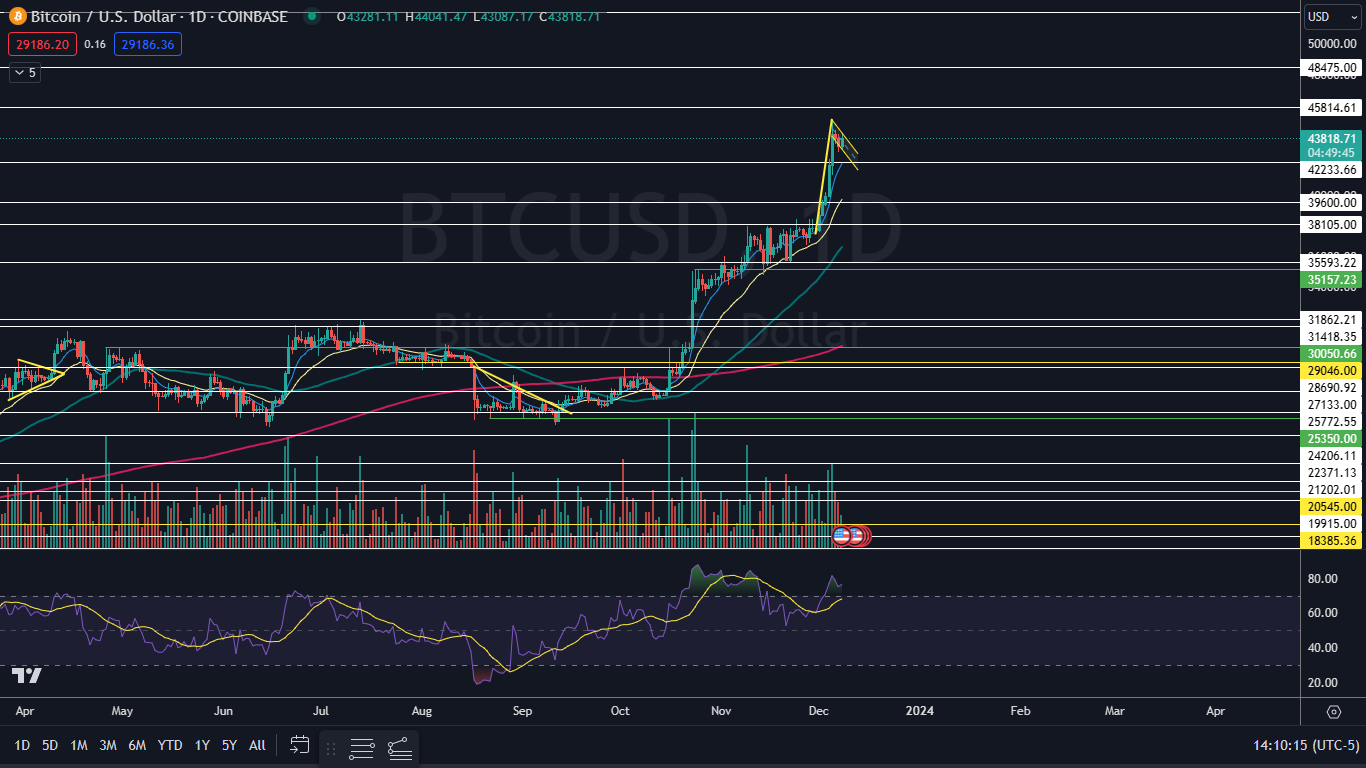
The Bitcoin Chart: Bitcoin’s possible bull flag pattern has formed between Nov. 30 and Friday, with the upward-sloping pole created between Nov. 30 and Tuesday and the flag forming since.
If the crypto breaks up from the flag on higher-than-average volume to indicate the pattern was recognized, the measured move is about 20%, which suggests Bitcoin could rally toward the $51,700 mark.
Bitcoin is also trading in a strong uptrend, making a series of higher highs and higher lows. The most recent higher low was formed on Thursday at $42,846 and the most recent higher high was printed at the $45,000 mark on Tuesday.
Bullish traders want to see continued consolidation help to drop Bitcoin’s relative strength index, which is currently trending in overbought territory, fall lower and then for big bullish volume to come in and break the crypto up from the flag. Bearish traders want to see big bearish volume drop Bitcoin down under the eight-day EMA, which would negate both the bull flag and the uptrend.
Bitcoin has resistance above at $45,814 and at $48,475 and support below at $42,233 and at $39,600.
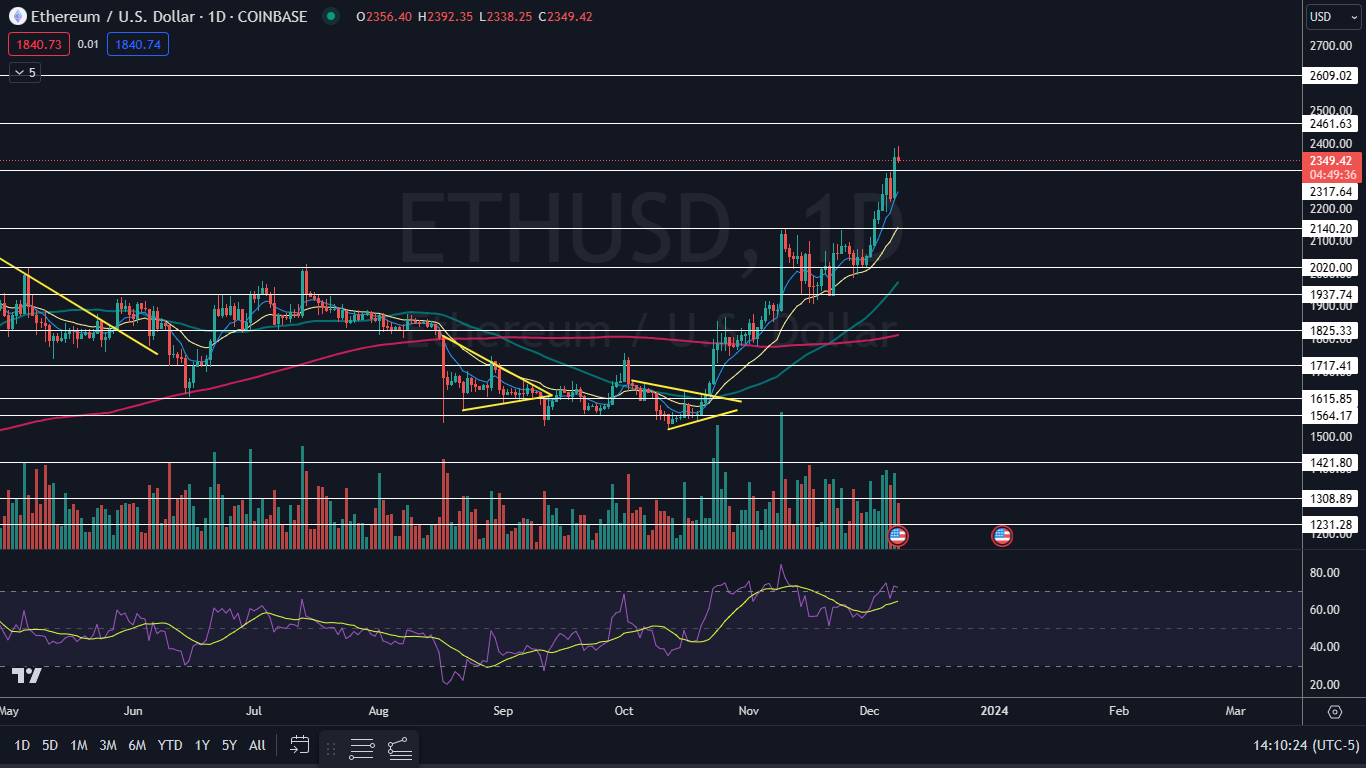
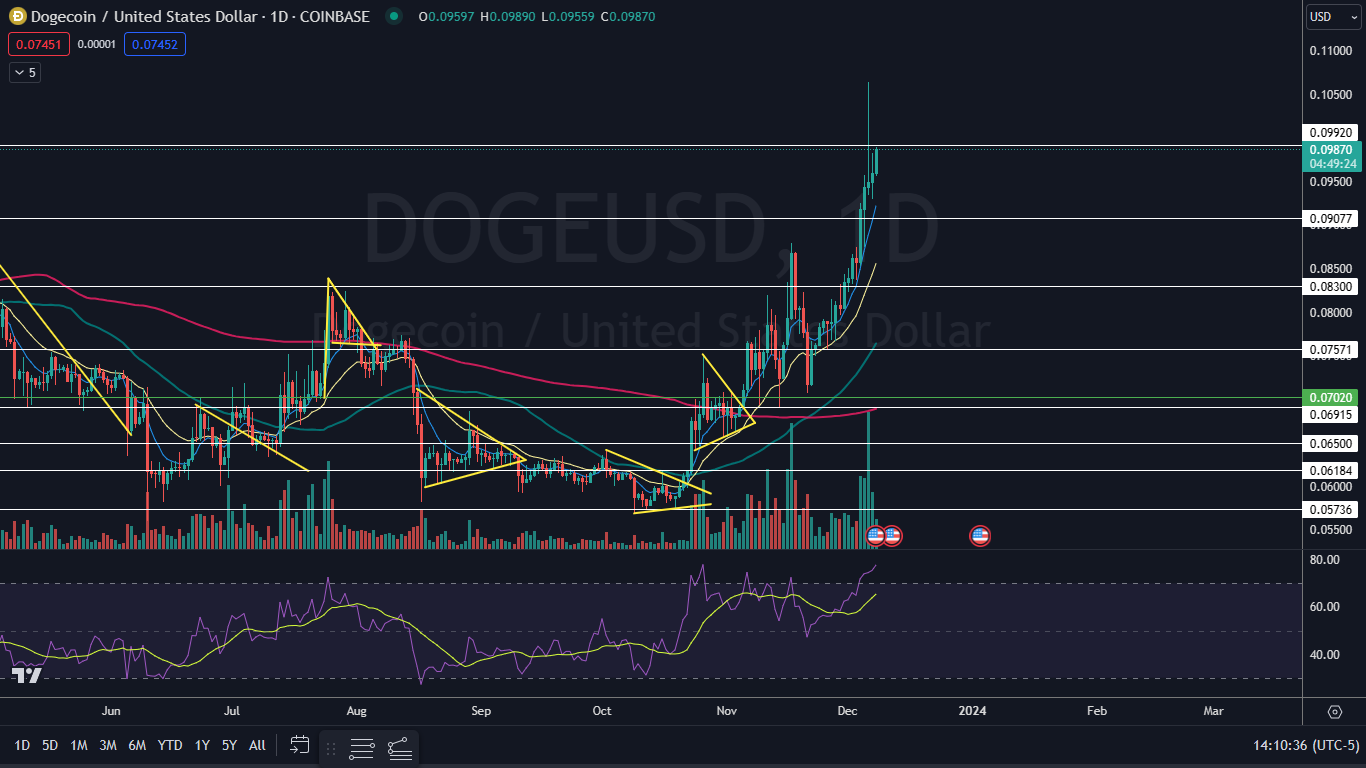
 The Ethereum and Dogecoin Charts: Ethereum and Dogecoin broke up from inside bar patterns temporarily on Friday and were continuing to trade within their uptrends.
Ethereum’s most recent higher high was formed on Nov. 24 at $2,134 and the most recent lower high was printed at the $1,985 level on Nov. 27. Dogecoin’s most recent higher high was created on Nov. 17 at $0.087 and the most recent higher low was formed at the 7-cent mark on Nov. 21.
Like with Bitcoin, bullish traders want to see Ethereum and Dogecoin consolidate sideways for a period of time to drop the crypto’s RSI levels and then for big bullish volume to come in and break the cryptos up above their most recent highs. Bearish traders want to see bearish pressure drop Ethereum and Dogecoin under their eight-day EMAs.
Ethereum has resistance above at $2,461 and at $2,609 and support below at $2,317 and at $2,140.
 Dogecoin has resistance above at $0.99 and at 12 cents and support below at the 9-cent mark and at $0.083.
 Read Next: LayerZero To Launch Native Token In 2024 - A Major Leap In Blockchain Interoperability
Edge Rankings
Price Trend
© 2025 Benzinga.com. Benzinga does not provide investment advice. All rights reserved.
Trade confidently with insights and alerts from analyst ratings, free reports and breaking news that affects the stocks you care about.