Zinger Key Points
- Bitcoin was retracing Friday, but working to print a possible double bottom pattern, which leans bullish if it holds.
- Grayscale's spot Bitcoin ETF was approved, offering institutions and retail traders direct access to Bitcoin through a regulated vehicle.
- Don't face extreme market conditions unprepared. Get the professional edge with Benzinga Pro's exclusive alerts, news advantage, and volatility tools at 60% off today.
Bitcoin BTC/USD was dropping almost 5% lower during Friday’s 24-hour trading session after rising up toward $50,000 on Thursday –the first trading day for 11 spot Bitcoin ETFs approved by the Security and Exchange Commission the day prior.
The SEC’s approval of the spot Bitcoin ETFs provides traditional finance with access to direct Bitcoin exposure. Previously, investors wanting regulated crypto exposure were limited to crypto-related stocks, primarily concentrated in the mining and trading of cryptocurrencies.
The first spot Bitcoin ETF to be approved by the federal agency was the Grayscale Bitcoin Trust ETF GBTC, which began trading at 4 a.m. EST on Thursday. Not only the first spot Bitcoin ETF to be approved, GBTC has the longest track record as the inaugural publicly traded Bitcoin fund in operation after being created in 2013 and is the world’s largest Bitcoin ETF.
Read Next: SEC Twitter Hacked: Fake Bitcoin ETF Approval Tweet Creates Market Mayhem
GBTC is also highly liquid, offering traders and investors a high level of flexibility to manage their trades, with an average 20-day trading volume of about 15,000 shares.
While the approval of the spot Bitcoin ETFs caused Bitcoin and Ethereum ETH/USD Dogecoin (CRYPTO: DOGE) has lagged the apex-cryptos, trading in a downtrend since Dec. 11.
Whether or not Bitcoin continues higher on a historic run or the SEC’s approval creates a long-term sell-the-news event remains to be seen but new institutional and retail investors with access to the crypto through Grayscale’s ETF, or one of its rivals, maybe watching for cues on Bitcoin’s chart as the news settles in.
Want direct analysis? Find me in the BZ Pro lounge! Click here for a free trial.
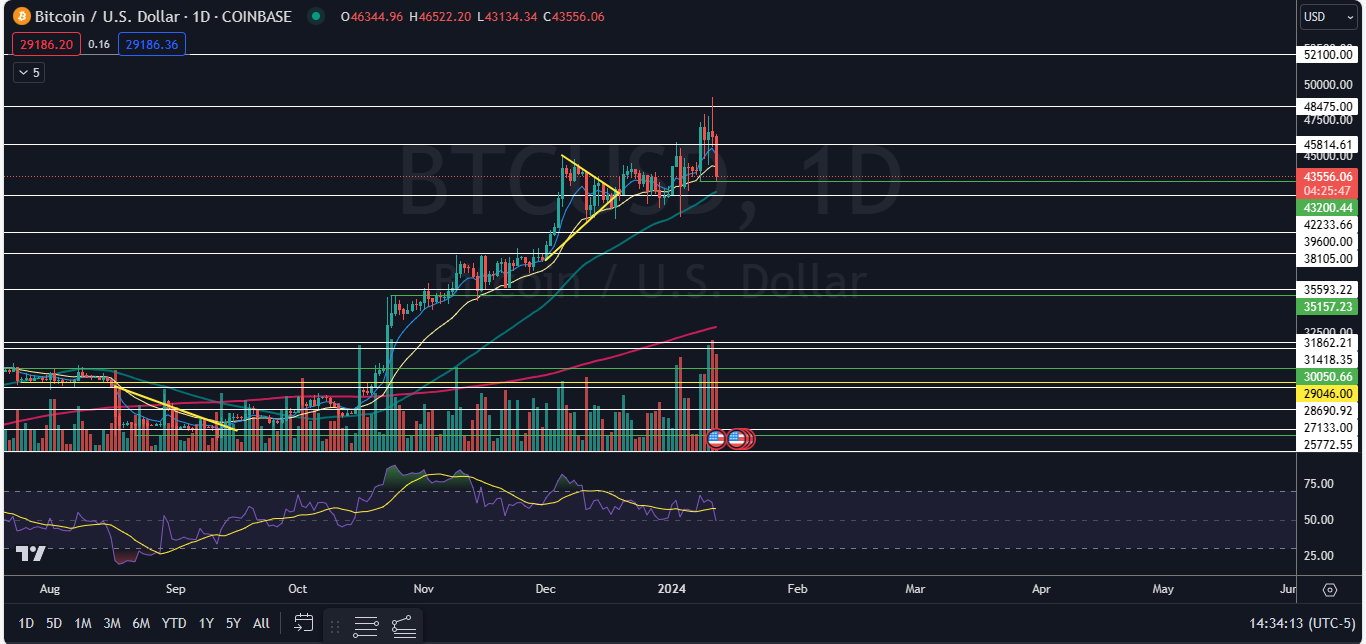
The Bitcoin Chart: When Bitcoin fell to its low-of-day Friday, the crypto bounced up slightly from the $43,130 mark, which caused Bitcoin to print a possible double bottom pattern at that level when paired with the low formed on Monday. If Bitcoin holds above that area, it would be bullish for continuation higher but if Bitcoin falls under that level on the weekend, the current uptrend will be negated and a downtrend could be on the horizon.
- A golden cross formed on Bitcoin’s chart on Oct. 11 and the 50-day simple moving average (SMA) has been guiding the crypto higher since that date. On Jan. 3, Bitcoin tested the 50-day SMA as support and bounced up off that area, if Bitcoin forms a lower low over the weekend, the 50-day SMA may once again act as support.
- Bullish traders want to see Bitcoin hold above $43,100 and begin to trade sideways on decreasing volume to indicate consolidation is taking place and then for big bullish volume to come in and drive Bitcoin to a new 52-week high.
- Bearish traders want to see big bearish volume come in and break Bitcoin down under the 50-day SMA, which could accelerate downside pressure.
- Bitcoin has resistance above at $45,814 and at $48,475 and support below at $42,233 and at $39,600.
 The Ethereum Chart: Ethereum reached a 20-month high of $2,717.89 on Friday before falling about 4.5% off that level intraday. The crypto has seen decreasing volume over the last two 24-hour trading sessions, indicating the bulls are becoming tired and consolidation may be needed.
- Ethereum’s relative strength index (RSI) reached about 72% on Thursday, which indicated a retracement was likely on the horizon. When a stock’s or crypto’s RSI reaches or exceeds the 70% mark, it becomes overbought, which can be a sell signal for short-term technical traders.
- On Friday, Ethereum was working to print a doji candlestick, which could indicate the local top has occurred and a retracement is in the cards. If Ethereum falls over the next few trading days, bullish traders want to see the crypto rebound from a descending trend line, which Ethereum broke up from on Wednesday. Bearish traders want to see Ethereum fall under that area, which could negate the crypto’s current uptrend.
- Ethereum has resistance above at $2,717 and at $2,950 and support below at $2,461 and at $2,317.
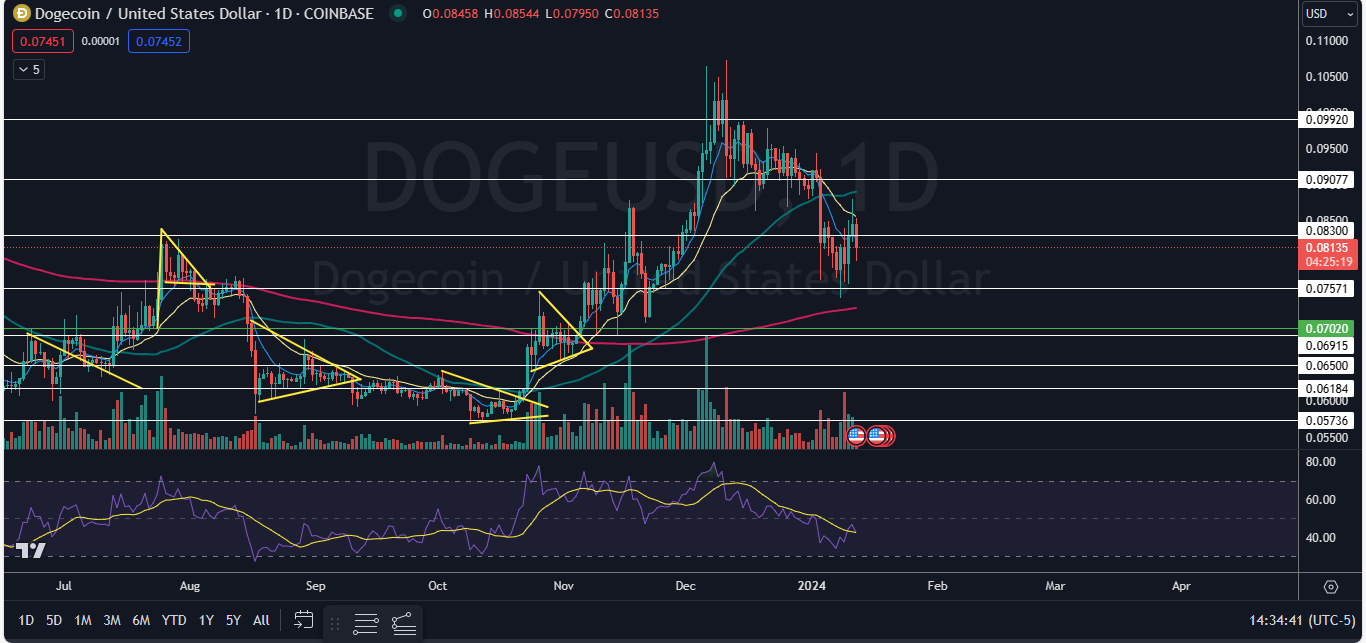
 The Dogecoin Chart: Dogecoin’s downtrend has been fairly consistent, with the Shiba Inu-themed crypto making a series of lower highs and lower lows. The most recent lower high was formed on Thursday at $0.088 and the most recent lower low was printed at the $0.074 mark on Monday.
- If Dogecoin falls under the $0.074 mark over the next few trading days, the crypto is likely to find at least temporary support at $0.073, which aligns with the 200-day SMA. If the crypto receives bullish momentum and rises above the most recent lower high, the downtrend will be negated and Dogecoin is likely to regain the 50-day SMA.
- Dogecoin has resistance above at $0.083 and at 9 cents and support below at $0.075 and at the 7-cent mark.

Edge Rankings
Price Trend
© 2025 Benzinga.com. Benzinga does not provide investment advice. All rights reserved.
Trade confidently with insights and alerts from analyst ratings, free reports and breaking news that affects the stocks you care about.