Zinger Key Points
- The IBIT ETF has amassed about $20 billion in assets since launch in Jan. with the ETF up 50% in price.
- Technical indicators show continued strength in the bull run, making IBIT a compelling option for Bitcoin exposure.
- Today's manic market swings are creating the perfect setup for Matt’s next volatility trade. Get his next trade alert for free, right here.
The iShares Bitcoin Trust IBIT, launched by BlackRock in January 2024, offers investors a convenient, cost-effective, and secure way to directly invest in Bitcoin BTC/USD through the familiarity of an ETF.
Up 50% In 5 Months of Trading – IBIT Has Amassed $20B In AUM
The fund, trading under the ticker IBIT on the Nasdaq Stock Exchange, has quickly garnered significant attention in the ETF space. Its trading volume had surpassed $1 billion on its very first trading day, and the fund has amassed about $20 billion over the past five months.
The ETF is up over 50% since it began trading on Jan. 11. The S&P 500 Index has gained just over 10% during the same period. Its underlying Bitcoin has surged about 66% since Jan. 11.
A Kerrisdale Capital investor note disclosure on Wednesday confirmed that the firm is “short shares of Riot Platforms Inc. (RIOT) RIOT and long shares of iShares Bitcoin Trust IBIT.” The firm issued a short report on Riot Platforms, citing its unpredictable revenue, high capital requirements, fierce competition.
Back in March, Kerrisdale sided with IBIT and Fidelity Wise Origin Bitcoin Fund FBTC over MicroStrategy Inc MSTR in a tweet:
Also Read: Bitcoin Spot ETFs On 15-Day Inflow Streak As Wisconsin Starts Buying Bitcoin
Will IBIT’s Strong Bullish Trend Continue?
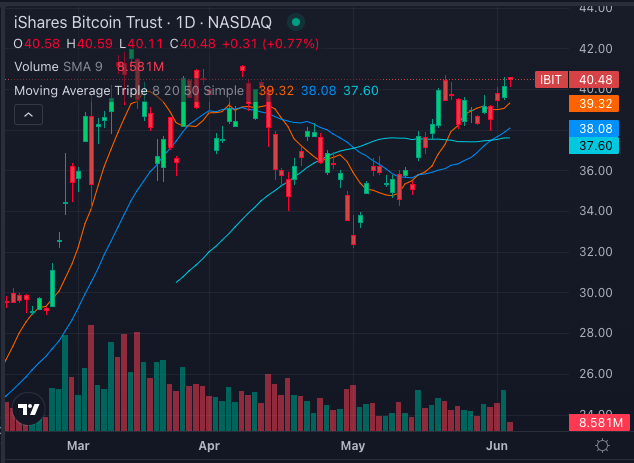
The IBIT ETF is currently experiencing a strong bullish trend. The share price is $40.48, which is above its 5-day, 20-day, and 50-day exponential moving averages (EMAs), indicating buying pressure and positive market sentiment.

Moving Averages
- 8-day Simple Moving Average (SMA): The IBIT share price of $40.48 is above its 8-day SMA of $39.32, signaling bullish sentiments.
- 20-day SMA: The 20-day SMA of $38.08, trading below the share price, is reinforcing the bullish signal.
- 50-day SMA: Similarly, the current share price is significantly higher than the 50-day SMA at $37.60, indicating a strong bullish momentum for the stock.
- 200-day SMA: Since the ETF is relatively new, the 200-day SMA is not available, but the existing short-term indicators are all positive.

Momentum Indicators
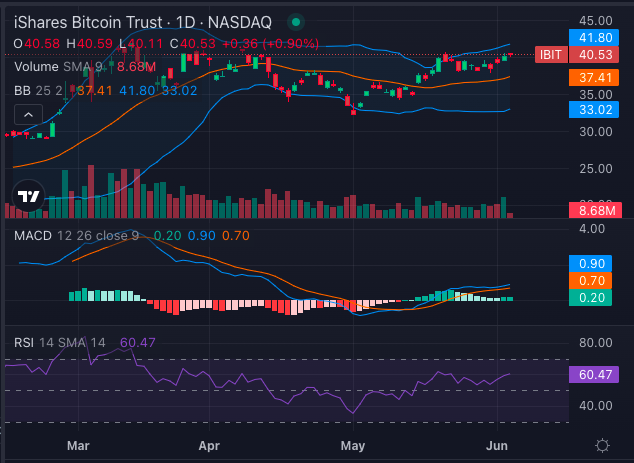
- MACD: The Moving Average Convergence Divergence (MACD) indicator for IBIT is 0.90, which is a bullish signal, suggesting continued upward momentum.
- RSI: The Relative Strength Index (RSI) stands at 60.47. While the rising RSI trend indicates that the ETF is approaching overbought territory, it remains bullish for now.
Bollinger Bands
- 25-Day Bollinger Bands: The bands are set between $33.02 and $41.80. With the current price at $40.53, the ETF is trading above the upper band, indicating a strong bullish trend.
Technical Analysis Points To Continued Strength In IBIT
The iShares Bitcoin Trust (IBIT) ETF shows strong bullish signals across multiple technical indicators. The share price consistently trading above its key moving averages and positive momentum indicators such as MACD and RSI suggest that IBIT is currently a Buy.
The Bollinger Bands also support this bullish sentiment, indicating that the ETF is experiencing substantial buying pressure.
While some financial advisors remain cautious about cryptocurrency investments, the technical analysis points to continued strength in IBIT.
Investors looking for exposure to Bitcoin through a regulated and accessible ETF may find the iShares Bitcoin Trust a compelling option.
Read Next: IBIT Overtakes GBTC As The Biggest Bitcoin ETF: Here’s How They Compare
Image generated using artificial intelligence via Midjourney.
© 2025 Benzinga.com. Benzinga does not provide investment advice. All rights reserved.
Trade confidently with insights and alerts from analyst ratings, free reports and breaking news that affects the stocks you care about.