Zinger Key Points
- Robinhood acquires Bitstamp for $200 million, expanding into institutional crypto markets and boosting global presence.
- Strong bullish sentiment surrounds Robinhood stock, with significant gains and positive technical indicators.
- Get two weeks of free access to pro-level trading tools, including news alerts, scanners, and real-time market insights.
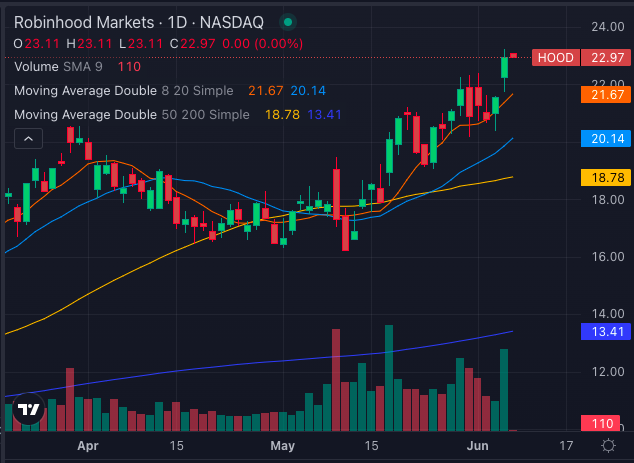
Robinhood Markets Inc HOOD closed at $22.97 on Thursday, recording a 6.49% gain. On Friday, the stock was up 3.35% by 6 a.m. ET in pre-market trading.
Robinhood’s rally comes on the heels of the company’s acquisition of cryptocurrency exchange Bitstamp Ltd. for $200 million.
The all-cash deal is expected to close in the first half of 2025. It marks a significant expansion for Robinhood; Bitstamp boasts a robust customer base and over 50 global licenses.
The deal positions Robinhood to grow its presence in crucial markets across North America, Europe and Asia.
Also Read: Is Robinhood’s Crypto Exchange Deal Really ‘Massive’ And The ‘First Domino To Fall?’
Robinhood Crypto Revenue Up 232%, Stock Up 80% YTD
Robinhood’s foray into the crypto realm has already paid off, with cryptocurrency revenue surging by an impressive 232%.
The value of crypto assets held by Robinhood users has seen a significant uptick, reflecting the growing appetite for digital currencies among its customer base.
Amidst this ambitious expansion, Robinhood’s stock performance has been noteworthy.
Over the past year, Robinhood stock has skyrocketed by 151.86%, with an impressive year-to-date growth of 80.30%.
Key Indicators Suggest Bullish Rally Ahead
Technical indicators further reinforce the bullish sentiment around Robinhood stock. Trading above its 5, 20 and 50-day exponential moving averages, the stock is under strong buying pressure.

The eight-day simple moving average of $21.67, the 20-day SMA of $20.14 and the 50-day SMA of $18.78 all signal a strong bullish momentum.
The 200-day SMA stands at $13.41, making the current price of $22.97 an attractive entry point.

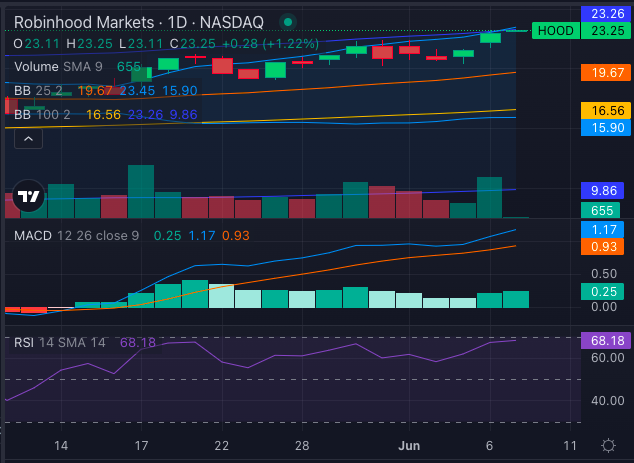
The Moving Average Convergence Divergence (MACD) indicator at 1.17 suggests bullishness, while the Relative Strength Index (RSI) at 68.18 and treading upwards, indicates the stock is closing in on being overbought.
Bollinger Bands (25) and (100) also point to a bullish signal, with ranges of $15.90 – $23.45 and $9.86 – $23.26, respectively.
Strong technical indicators back up Robinhood’s bullish momentum at a time when the company finds itself in a regulatory dispute. The U.S. Securities and Exchange Commission recently issued a Wells Notice, potentially leading to enforcement actions.
© 2025 Benzinga.com. Benzinga does not provide investment advice. All rights reserved.
Trade confidently with insights and alerts from analyst ratings, free reports and breaking news that affects the stocks you care about.