Zinger Key Points
- Spotify stock holders have seen a good rally so far this year with the stock up 120% YTD.
- A Golden Cross on the technical chart indicates the rally may sustain.
- Join Chris Capre on Sunday at 1 PM ET to learn the short-term trading strategy built for chaotic, tariff-driven markets—and how to spot fast-moving setups in real time.
Spotify Technology SA SPOT is trading higher on news about workforce reduction. SPOT shares were up over 10% by 10 a.m. ET on Monday.
This brings the price return to SPOT investors to about 20% just for the past month. On a year-to-date basis, SPOT stock has returned over 120% to its investors. We’ll look at the reasons behind the rally, and what the charts say about the sustainability of SPOT stock rally.
On Monday, news of Spotify reducing its workforce by 17% triggered a rally in its stock as investors expect a leaner organization to perform better in the face of any macroeconomic headwinds.
Related: Spotify’s Bold Move – CEO Announces Drastic 17% Workforce Cut
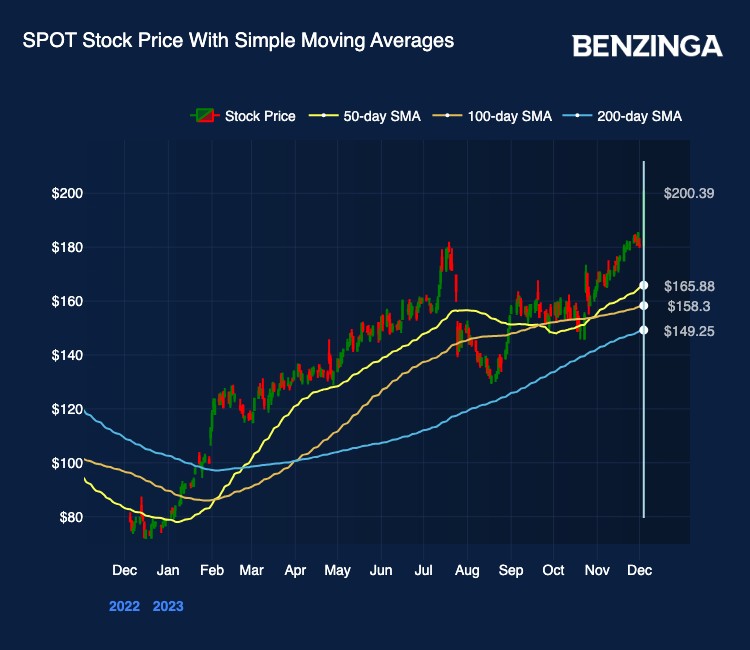
The technical price chart indicates that the trend should continue.

Observe the 50-day SMA (simple moving average) line in yellow above and the 100-day SMA in orange. The last time the 50-day SMA crossed over the 100-day SMA from below (popularly known as the Golden Cross) in February, it triggered a rally in Spotify stock. This rally extended up to mid-July, when both the 50 and 100-day SMAs reversed the trend along with the price.
The Death Cross that happened mid-September, when the 100-day SMA crossed over the 50-day SMA from below, solidified the trend reversal in Spotify stock and the stock continued its downtrend from there.
Then again towards October end, we see the 50-day SMA crossing over the 100-day SMA, creating another Golden Cross, and marking the beginning up another uptrend. Quite evidently, the stock and its moving averages have been trending higher since.
The rally in Spotify stock could probably extend further, as indicated by the Golden Cross, till trends reverse.
Read Next: Spotify’s Stock Gains On Q3 Performance, Clocks Strong MAU and Premium Revenue Growth
Edge Rankings
Price Trend
© 2025 Benzinga.com. Benzinga does not provide investment advice. All rights reserved.
Trade confidently with insights and alerts from analyst ratings, free reports and breaking news that affects the stocks you care about.