Zinger Key Points
- As the S&P 500 flirts with the 5,000-point milestone, half of the index continues to trade below the 50-day moving average.
- In total, there are 232 S&P 500 stocks currently trading below their 50-day moving averages.
- Learn how to trade volatility during Q1 earnings season, live with Matt Maley on Wednesday, April 2 at 6 PM ET. Register for free now.
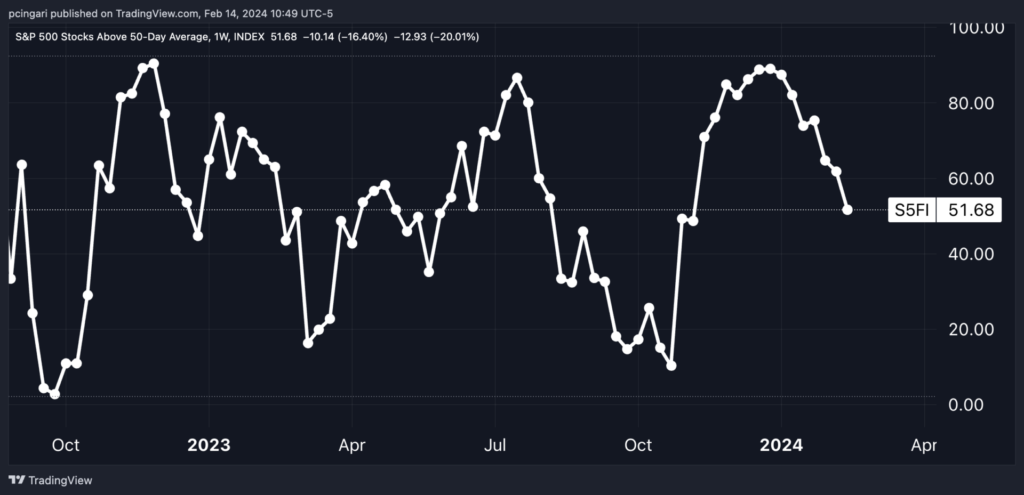
As the S&P 500 index continues to hover near the 5,000-point threshold, not far from its all-time highs, the remarkable surge of over 20% since late October levels created a stark divide with many corporations failing to join the market rally.
As of mid-February, nearly half of S&P 500 stocks were trading below the 50-day moving average, which represents a widely recognized technical indicator employed by traders for evaluating the short to medium-term direction of a stock’s price movement.
This observation suggests a substantial portion of the index’s components remains ensnared by bearish sentiment, highlighting a poor market breadth.
Chart: Only 51% Of S&P 500 Stocks Is Trading Above 50-Day Moving Average

In total, there are 232 S&P 500 stocks currently trading below their 50-day moving averages, among which 202 have a market capitalization of less than $100 billion. The remaining 30 stocks belong to the echelons of mega-cap companies, although they constitute just one-third of that exclusive group.
The contrast becomes even more pronounced when considering that only five out of the top 30 companies in the index are trading below their 50-day moving average. This suggests the elite tier of the S&P 500 largely remained well shielded from bearish pressures.
Top 10 Cheapest S&P 500 Companies, According To 50-Day Moving Average
Charter Communications, Inc. CHTR, Archer-Daniels-Midland Company ADM, and MarketAxess Holdings Inc. MKTX are the three companies that trade the most “at a discount” relative to this technical indicator with distances of 20%, 19%, and 17%, respectively, off the 50-day average. None of these three corporations have a market capitalization in excess of $50 billion.
A significant surprise comes in fourth place, as Tesla Inc. TSLA is positioned there, about 16% off its 50-day average.
With a market capitalization of almost $590 billion, Tesla is one of the mega-cap outliers in the group of S&P 500 companies that trade below the 50-day average. Within this group, there is Boeing Co BA, now 11% away from its moving average.
| Company | Price vs. 50D Average | Price Chg. % (YTD) |
| Charter Communications, Inc. | -20.07% | -25.59% |
| Archer-Daniels-Midland Company | -19.38% | -26.96% |
| MarketAxess Holdings Inc. | -16.44% | -25.02% |
| Tesla, Inc. | -16.30% | -25.12% |
| Air Products and Chemicals, Inc. APD | -16.07% | -20.74% |
| Humana Inc. HUM | -15.81% | -20.97% |
| Newmont Corporation NEM | -15.17% | -23.05% |
| Healthpeak Properties, Inc. PEAK | -12.55% | -15.45% |
| The Mosaic Company MOS | -12.51% | -17.42% |
| EQT Corporation EQT | -12.47% | -16.66% |
Top 10 Richest S&P 500 Companies, According To 50-Day Moving Average
Inverting the focus to stocks that have largely exceeded the 50-day moving average’s support, NVIDIA Corp. NVDA, Meta Platforms Inc. META, and Ely Lilly and Co LLY lead the ranking, with 32%, 25%, and 21%, respectively, price premiums compared to the technical indicator.
Uber Technologies Inc. UBER and Ralph Lauren Corp. RL follow closely after with a 20% premium.
| Company | Price vs. 50D Average | Price Chg. % (YTD) |
| NVIDIA Corporation | 32.40% | 49.35% |
| Meta Platforms, Inc. | 24.70% | 33.16% |
| Eli Lilly and Company | 21.09% | 30.65% |
| Uber Technologies, Inc. | 20.59% | 25.00% |
| Ralph Lauren Corporation | 20.26% | 20.76% |
| Catalent, Inc. CTLT | 18.79% | 25.93% |
| Monolithic Power Systems, Inc. MPWR | 18.05% | 16.14% |
| Walt Disney Co DIS | 17.51% | 23.15% |
| Lam Research Corporation LRCX | 16.82% | 18.02% |
| Palo Alto Networks, Inc. PANW | 16.02% | 26.34% |
Edge Rankings
Price Trend
© 2025 Benzinga.com. Benzinga does not provide investment advice. All rights reserved.
Trade confidently with insights and alerts from analyst ratings, free reports and breaking news that affects the stocks you care about.