Zinger Key Points
- Amid tech hype, U.S. energy stocks quietly rallied with Energy Select Sector SPDR Fund up 16% from January lows.
- Oil and gas prices have surged, yet Wall Street analysts overlook energy sector's potential upside.
- Join Chris Capre on Sunday at 1 PM ET to learn the short-term trading strategy built for chaotic, tariff-driven markets—and how to spot fast-moving setups in real time.
While the investor spotlight remains fixated on tech and AI-related stocks, U.S. energy corporations have quietly embarked on a significant, albeit unnoticed, rally.
The Energy Select Sector SPDR Fund XLE, a gauge for U.S. energy stocks, has posted a robust 16% rally from its January 2024 lows, outshining all other S&P 500 sectors over the past month.
This week’s surge could potentially mark the sector’s longest winning streak since October 2021, with the Energy Select Sector SPDR Fund now a mere three percentage points shy of its November 2022 highs.
Oil And Natural Gas Rise, But Wall Street Has Yet To Wake Up
The backbone of this upward trajectory has been the recent upswing in oil and natural gas prices. West Texas Intermediate (WTI) light crude has seen a 15% increase year-to-date, breaking past $82 a barrel, a peak last observed in early November 2023.
Similarly, Henry Hub natural gas prices have jumped 16% from a month earlier, rebounding from near four-year lows.
This uptick in commodity prices has been the main driver behind the energy stock rally, yet it hasn’t translated into analyst optimism in terms of revised price targets and earnings forecasts.
Exxon Mobil Corp. XOM, the heavyweight in the Energy Select Sector SPDR Fund’s portfolio, exemplifies this anomaly. Despite the rise in crude prices, Exxon’s median price target has slightly declined from $125 at the end of 2023, when oil traded at $70, to $121 as of March 19, 2024, with crude prices 15% higher year to date.
The median price target for stocks within the Energy Select Sector SPDR Fund has largely stayed the same since the year’s outset.
This suggests that the sector’s rally has gone largely unnoticed by prominent Wall Street analysts, hinting at a possible additional uplift if they begin to adjust their forecasts upward.
Strong Seasonality Looms
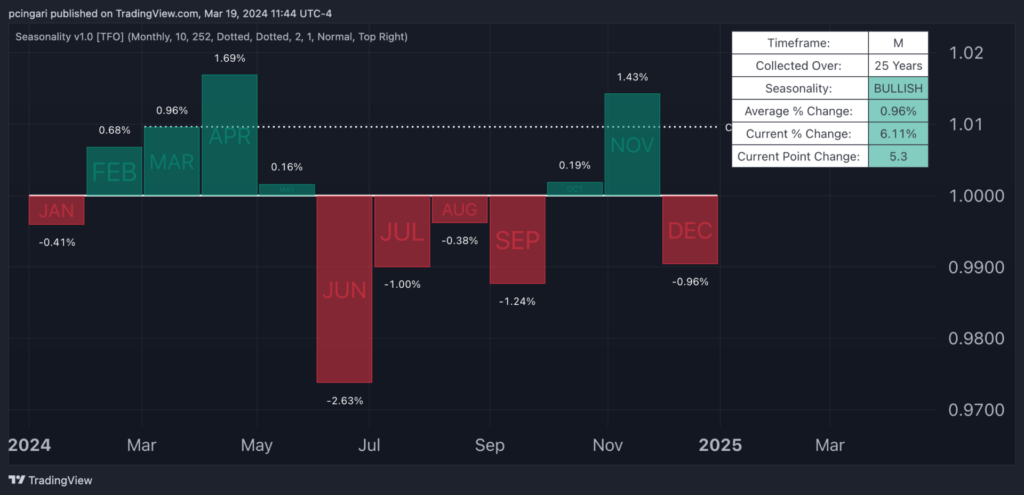
Historically, U.S. energy stocks have shown a propensity to perform well during March and April, with the latter month often marking the peak of annual returns.
Data spanning 25 years since the inception of the Energy Select Sector SPDR Fund reinforces this trend, with average returns of nearly 1% in March and 1.7% in April.

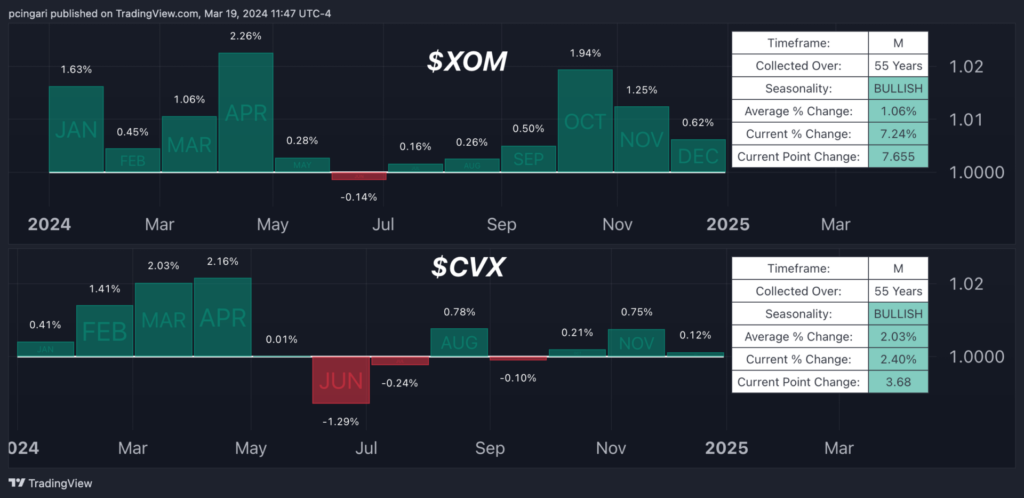
This pattern is further confirmed by the 55-year past performance of Exxon Mobil and Chevron Corp CVX, both of which typically see their highest monthly returns in April.

Technical Indicators Looks Bullish
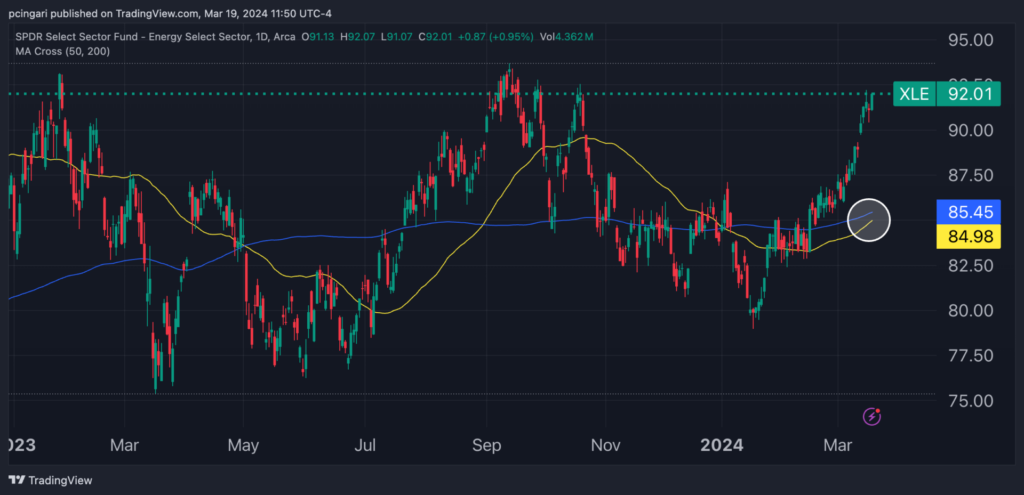
The bullish momentum in U.S. energy stocks is not only supported by fundamental and seasonal factors but also by technical indicators, with the potential for an imminent golden cross signal. Observing the daily chart, the 50-day moving average is on the brink of crossing above the 200-day average, a signal last seen in late August 2023, which drove the energy stock gauge higher by mid-September of that year.
With the highs from November 2022 within reach, and the all-time highs from July 2024 at an 11 percentage point distance, the technical outlook appears promising. Furthermore, weekly relative strength index (RSI) levels have surged above the 60 mark, indicating that bulls currently dominate the near-term trend.
A positive weekly close would mark the sixth consecutive week of gains for U.S. energy stocks, representing the longest streak since October 2021. Notably, the record for the longest streak belongs to May 2007 when the XLE ETF recorded nine consecutive weeks of gains.
Chart: Golden Cross Looms On U.S. Energy Stocks

Read Now: Gas Prices Set For Summer Spike: West Coast Consumers Already Paying More Than $4 A Gallon
Photo: Shutterstock
Edge Rankings
Price Trend
© 2025 Benzinga.com. Benzinga does not provide investment advice. All rights reserved.
date | ticker | name | Price Target | Upside/Downside | Recommendation | Firm |
|---|
Trade confidently with insights and alerts from analyst ratings, free reports and breaking news that affects the stocks you care about.