Zinger Key Points
- Over $28 billion has flowed out of SPY this year, despite a rising U.S. stock market, hinting at cost concerns.
- With a 0.09% expense ratio, SPY is losing ground to VOO and IVV, which charge only 0.03%, influencing large-scale asset shifts.
- Feel unsure about the market’s next move? Copy trade alerts from Matt Maley—a Wall Street veteran who consistently finds profits in volatile markets. Claim your 7-day free trial now.
A seismic shift is currently underway among the world’s largest exchange-traded funds (ETFs), which could redefine the landscape of the ETF universe.
The SPDR S&P 500 ETF Trust SPY, the largest ETF globally with over $500 billion in assets under management, experienced significant outflows since the beginning of the year.
In contrast, its lower-cost peers, especially the Vanguard S&P 500 ETF VOO, saw an influx of investments.
What’s driving this trend?
Outflows From SPY ETF On The Rise
The SPDR S&P 500 ETF Trust witnessed outflows totaling $28 billion since the year’s start, according to data from Vettafi.
This shift is notable because it occurs against a backdrop where the U.S. stock market has been on the rise, indicating that the performance of the underlying investments isn’t the cause of the outflows.
The primary driver behind this shift appeared to be the cost associated with managing these funds, rather than their performance.
SPY has an expense ratio of 0.09%, significantly higher than some of its direct competitors. Even a few basis points can make a considerable difference in investor returns over time, especially for institutional or very large individual investors.
Chart: SPY ETF Witnesses $28 Billion In Outflows Year-To-Date

Inflows In Lower-Cost Peers
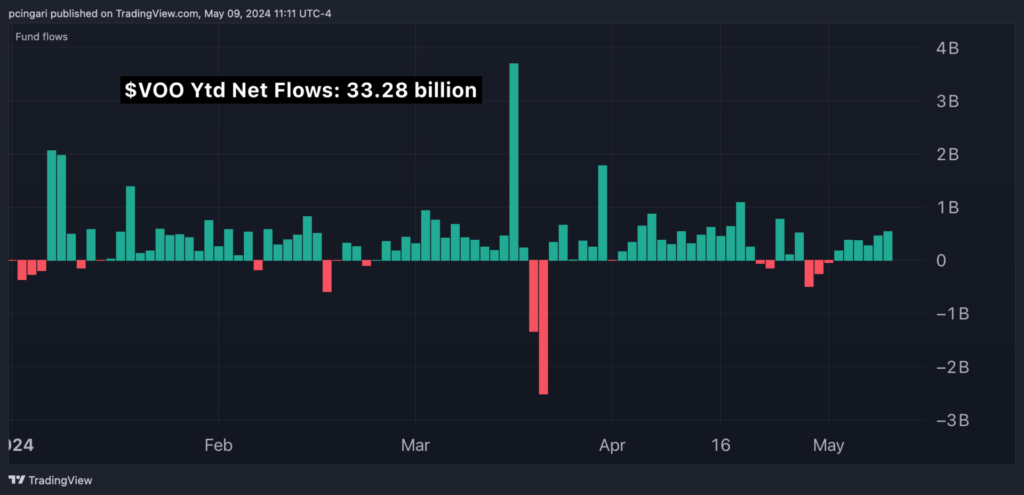
While SPY has been seeing outflows, the Vanguard S&P 500 ETF welcomed inflows of $33 billion during the same period. Another competitor, iShares Core S&P 500 ETF IVV, attracted $14.53 billion.
These ETFs track the same index as SPY and have nearly identical portfolios.
The distinguishing factor is their expense ratios: the Vanguard S&P 500 ETF and the iShares Core S&P 500 ETF charge just 0.03%, compared to SPY's 0.09%.
Chart: VOO ETF Sees Over $33 Billion In Inflows Year-To-Date

Read Also: 5 Things You Need To Know About Vanguard ETFs: Why There’s No Bitcoin ETF In Their Lineup?
Should You Switch From SPY to VOO?
Although a difference of 0.06% in expense ratios might seem negligible, it becomes significant with larger investments or over extended periods.
For instance, on a $10,000 investment, choosing VOO over SPY saves an investor $6 annually. However, for a $10 million investment, the annual savings jump to $6,000.
To illustrate the long-term impact, consider an investor who starts with a $100,000 investment in an S&P 500 fund. Assuming an average annual return of 7%, after 20 years, this investment would grow to $384,803 with VOO, compared to $380,509 with SPY, due to the difference in expense ratios.
Over time, these seemingly small differences can result in substantial divergences in end wealth, due to the effect of compounding returns.
Thus, for individual investors, particularly those with substantial amounts or long investment horizons, the cost savings from ETFs associated with lower expense ratios should not be overlooked.
If a person was considering a switch from SPY to VOO, it’s essential to weigh these factors along with any potential tax implications or transaction costs associated with such a move.
For many, the long-term savings on fees could justify the switch, enhancing overall returns while keeping the same portfolio structure.
Yet, if a person had significant holdings in the SPY, they need to consider the tax costs associated with selling their shares. To avoid these potential tax liabilities, maintain the investment in SPY and start diverting new funds into a more cost-effective ETF, such as the VOO or the iShares Core S&P 500 ETF (IVV).
Table Comparison: SPY vs. VOO vs. IVV
| SPDR S&P 500 ETF Trust (SPY) | Vanguard S&P 500 ETF (VOO) | iShares Core S&P 500 ETF (IVV) | |
| Issuer | State Street Global Advisor | Vanguard | iShares – BlackRock Inc. BLK |
| Index tracked | S&P 500 | S&P 500 | S&P 500 |
| Asset under management | $511.36 billion | $440.59 billion | $451.03 billion |
| Net flows (ytd) | $-28.06 billion | $33.28 billion | $14.53 billion |
| Expense ratio | 0.09% | 0.03% | 0.03% |
| Annual dividend yield | 1.30% | 1.35% | 1.33% |
| YTD Return | 9.15% | 9.19% | 9.18% |
| 3-year Return | 8.60% | 8.66% | 8.66% |
| 5-year Return | 14.25% | 14.30% | 14.34% |
Read Now: Why Veteran Wall Street Investor Believes We’re Still In A Bull Market
Photo: YO Alexandre via Shutterstock
Edge Rankings
Price Trend
© 2025 Benzinga.com. Benzinga does not provide investment advice. All rights reserved.
Trade confidently with insights and alerts from analyst ratings, free reports and breaking news that affects the stocks you care about.