Zinger Key Points
- Regional bank stocks are still about 13% lower than pre-SVB collapse levels, indicating persistent investor caution.
- The banking industry reported $64.2 billion net income in Q1, a 79.5% increase from the previous quarter.
- Feel unsure about the market’s next move? Copy trade alerts from Matt Maley—a Wall Street veteran who consistently finds profits in volatile markets. Claim your 7-day free trial now.
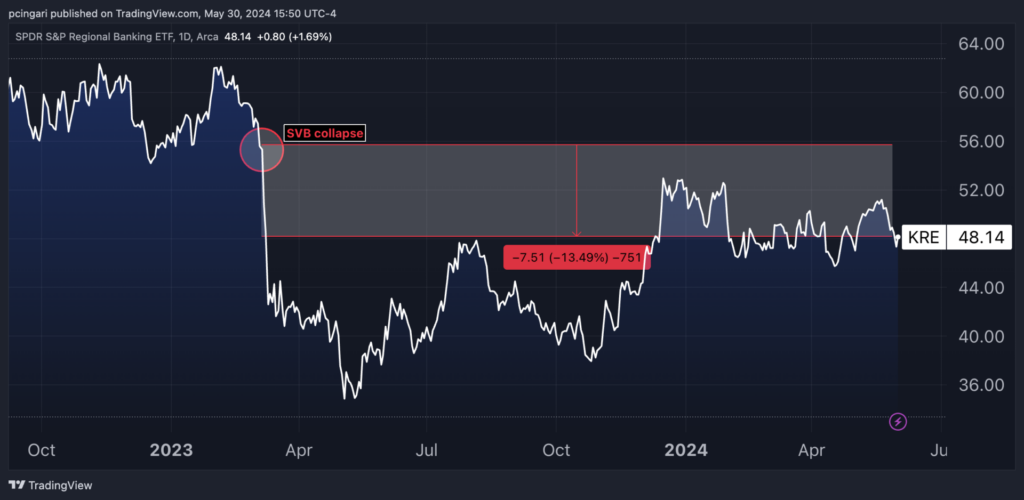
Regional bank stocks, as monitored through the SPDR S&P Regional Banking ETF KRE, continue to trade about 13% lower than they were prior to the collapse of Silicon Valley Bank in March 2023, indicating that investor sentiment has yet to fully regain trust in the industry following last year’s sharp drop.
The first-quarter earnings season has been notably positive for the Financials sector, which showed the largest positive difference between actual revenues and estimated revenues, according to FactSet earnings insights.
Chart: Regional Bank Industry Trades 13% Lower Its Pre-SVB Levels

A Resilient Quarter For Community Banks
“The banking industry continued to show resilience in the first quarter,” the Federal Deposit Insurance Corporation (FDIC) stated in its latest Quarterly Banking Profile report, released this week.
The banking industry reported a net income of $64.2 billion for the first quarter, reflecting a 79.5% increase from the previous quarter. This significant rise was primarily attributed to reduced expenses related to the FDIC special assessment and decreased goodwill write-downs.
Notably, “community banks reported net income of $6.3 billion, a quarterly increase of 6.1%, driven by better results on the sale of securities and lower noninterest and provision expenses,” the FDIC wrote.
While overall banking loan growth was rather shallow, up by 1.7% from last year, marking the slowest rate since Q3 2021, loan growth at community banks was more robust, increasing by 7.1% from the prior year, led by commercial real estate and residential mortgage loans.
Domestic deposits increased for a second consecutive quarter, this time by $191 billion, driven by growth in transaction accounts. The regulator highlighted an ongoing transition from noninterest-bearing deposits toward interest-bearing deposits, with the latter increasing 1.7% quarter over quarter and the former declining for the eighth consecutive quarter.
The number of banks on the Problem Bank List, increased from 52 in Q4 2023 to 63 in Q1 2024.
Although the number of problem banks was 43 a year ago, the increase to 63 banks still represents just 1.4% of the total banks. This percentage remains within the typical range of 1-2% seen during non-crisis periods, and well below levels seen during the 2008 financial crisis and 2022 financial condition stress.
Top-Performing Regional Bank Stocks In May
| Name | Total Return (1M) |
| Independent Bank Group, Inc. IBTX | 25.20% |
| New York Community Bancorp, Inc. NYCB | 24.53% |
| Flushing Financial Corporation FFIC | 14.66% |
| Sandy Spring Bancorp, Inc. SASR | 13.47% |
| Coastal Financial Corporation CCB | 13.39% |
| National Bank Holdings Corporation NBHC | 11.30% |
| Capitol Federal Financial, Inc. CFFN | 10.97% |
| Western Alliance Bancorporation WAL | 10.60% |
| TFS Financial Corporation TFSL | 9.41% |
| Synovus Financial Corp. SNV | 9.11% |
Read now: Fed’s Favorite Inflation Data Due Friday: How Could Markets React To Surprises?
Photo: Shutterstock
Edge Rankings
Price Trend
© 2025 Benzinga.com. Benzinga does not provide investment advice. All rights reserved.
Trade confidently with insights and alerts from analyst ratings, free reports and breaking news that affects the stocks you care about.