Zinger Key Points
- The S&P 500 Index, a measure of broader market performance, has gained a robust 14.48% so far this year.
- The index last hit a record of 5,487.03 on June 18, and breached the 5,500 mark in intraday trading on June 20.
- Feel unsure about the market’s next move? Copy trade alerts from Matt Maley—a Wall Street veteran who consistently finds profits in volatile markets. Claim your 7-Day free trial now.
The stock market is up solidly this year, thanks to expectations of rate cuts by the Federal Reserve amid easing inflationary pressure, strong corporate earnings and optimism over the potential of artificial intelligence technology’s potential.
Building On Gains: The S&P 500 Index, a measure of broader market performance, has gained a robust 14.48% so far this year, and it is up 3.92% for the second quarter. The index last hit a record closing high (5,487.03) on June 18, and breached the 5,500 mark intraday on June 20. Since then, the broader gauge has been going about a consolidation move.
The SPDR S&P 500 ETF Trust SPY, an exchange-traded fund that tracks the performance of the S&P 500 Index, ended Friday’s session down 0.39% at $544.22, according to Benzinga Pro data.
Analysts are optimistic about further gains in the second half of the year. Following the S&P 500’s record run, most have raised their year-end targets. Evercore ISI now has the highest estimate, predicting the index will end the year at 6,000.
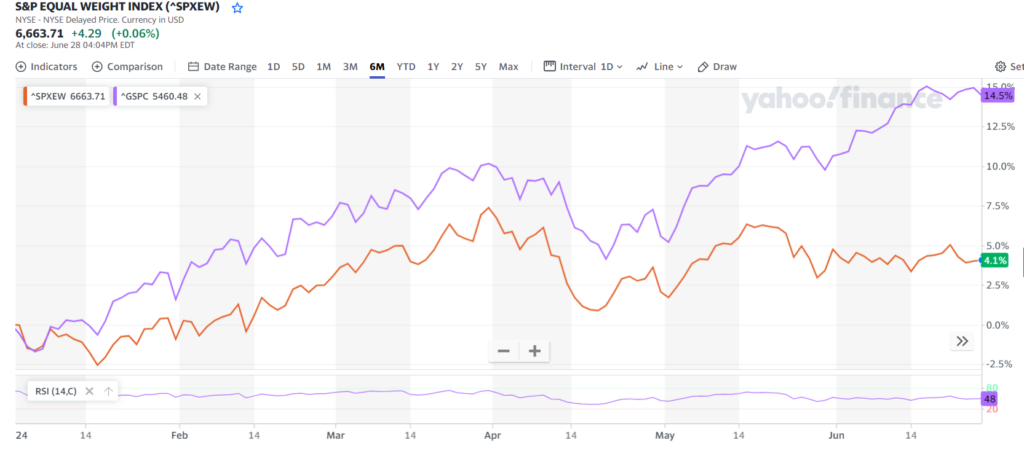
Top Heaviness A Concern? Notwithstanding the equity market’s extended run, investors and analysts alike are concerned about the concentration of gains among a select few stocks. This is evident from the relative underperformance of the S&P EQUAL WEIGHT INDEX, in which the index components are accorded uniform weighting, versus the market cap-weighted S&P 500 Index.

Source: Yahoo Finance.
The 10 largest stocks as a percentage of the S&P 500’s overall market cap have surged to 38%, Charles Schwab said in a recent report. Ark Invest’s Cathie Wood stated in a recent webinar that market concentration has reached an extreme, surpassing levels seen during the Great Depression in 1932.
See Also: Best Value Stock
Here’s a look at S&P 500 leaders and laggards of the first-half:
| Leaders | ||
| 1. | Super Micro Computer Inc. SMCI | +188.2% |
| 2. | Nvidia Corp. NVDA | +149.5% |
| 3. | Vistra Corp. VST | +123.2% |
| 4. | Constellation Energy Corporation CEG | +71.3% |
| 5. | General Electric Company GE | +56.2% |
| Laggards | ||
| 1. | Walgreens Boots Alliance, Inc. WBA | -53.7% |
| 2. | Lululemon Athletica Inc. LULU | -41.6% |
| 3. | Intel Corporation INTC | -38.4% |
| 4. | EPAM Systems, Inc. EPAM | -36.7% |
| 5. | Warner Bros. Discovery, Inc. WBD | -34.46% |
Nvidia and Texas-based utility company Vistra also feature among the top five gainers for the second quarter. Others rounding off the list are First Solar, Inc. FSLR, GE Vernova Inc. GEV, a utility company splintered from GE, and semiconductor testing company Teradyne, Inc. TER.
Second-quarter decliners include the year-to-date laggards Walgreens Boots Alliance, Intel and EPAM Systems. The other two top-five poor performers are Estée Lauder Companies Inc. EL and building products and equipment maker Builders FirstSource, Inc. BLDR.
The top five gainers belonged mostly to the tech and utility sectors, while the laggards were mostly from consumer stocks.
Look Ahead: The outlook is largely positive heading into the second half of 2024, said Morgan Stanley analysts in the firm’s mid-year outlook. The firm’s expectation is predicated on the Fed rate cut materializing in September. The futures market is pricing in a 64% probability of a rate cut in September.
JPMorgan analysts also see positive momentum continuing.
“The end of monetary tightening combined with strong nominal GDP growth provide a constructive backdrop for U.S. equities over the remainder of the year,” the analysts said.
Fed rate cuts are widely seen as a precursor for the broadening of the stock market rally. The underperformers of the first-half of the year could bounce back strongly when inflation eases further, allowing the central bank to take down interest rates from 22-year highs.
Ark Invest’s Wood sees the scope of a strong rebound. After concentration peaked during the Great Depression, the market rose 62% over the next three to four years. The gains were disproportionately favoring the smaller and mid-cap stocks as opposed “to the mega-cap cash fortresses,” she said.
Candidates For Outperformance: Benzinga screened some lagging stocks that are poised to outperform when the macro and geopolitical environment turn benign. The criteria used for screening are SMID-cap stocks, average volume greater than 50,000, average analysts’ price target of “Buy” or better, average analysts’ price target of 20% higher than the current price and relative strength index less than 40. These include:
- Bath & Body Works, Inc. BBWI
- American Airlines Group Inc. AAL
- Dayforce Inc DAY
- BorgWarner Inc. BWA
- Bio-Rad Laboratories, Inc. BIO
Photo: Shutterstock
Edge Rankings
Price Trend
© 2025 Benzinga.com. Benzinga does not provide investment advice. All rights reserved.
Trade confidently with insights and alerts from analyst ratings, free reports and breaking news that affects the stocks you care about.