Zinger Key Points
- Nordson reports a declined in its net income in Q4 of the current fiscal.
- FY25 revenue guidance misses analyst expectations.
- NOW OPEN: 200 Charter Memberships to Benzinga Trade Alerts
Nordson Corp NDSN fell by 5.43% to $236.01 in after-hours on Wednesday as the company revenue guidance for the fiscal year 2025 was below analyst expectations. However, the technical analysis using simple moving averages indicates that the stock remains under pressure pointing toward a bearish trend.
What Happened: Nordson recorded a net income of $122 million for the fourth quarter of the current fiscal, which was less than the net income of $128 million in the same quarter of the previous fiscal year.
The company which makes spraying equipment for agricultural use had its net sales increase by 4% year-on-year. It recorded $744 million in revenue for the period, compared to $719 million in the prior year’s fourth quarter.
On a full-year basis, Nordson recorded record sales of $2.7 billion, reflecting 2% growth over last fiscal’s record sales. The net income for the year was $467 million, a decrease from the prior year's net income of $487 million.
Nordson revenue guidance for the upcoming fiscal 2025 was between $2.75 billion and $2.87 billion, which was below analysts’ expectations of $2.93 billion, according to data compiled by LSEG.
Also read: Earnings Summary: Nordson Q4
Why It Matters: Nordson Corp’s stock has declined by 3.52% on a year-to-date basis and advanced by 7.23% in the last six months. This compares to a 31.55% and 11.81% performance by the Nasdaq 100 Index in the same period, respectively.
From a technical perspective, the analysis of daily moving averages indicates that the stock may be under pressure.
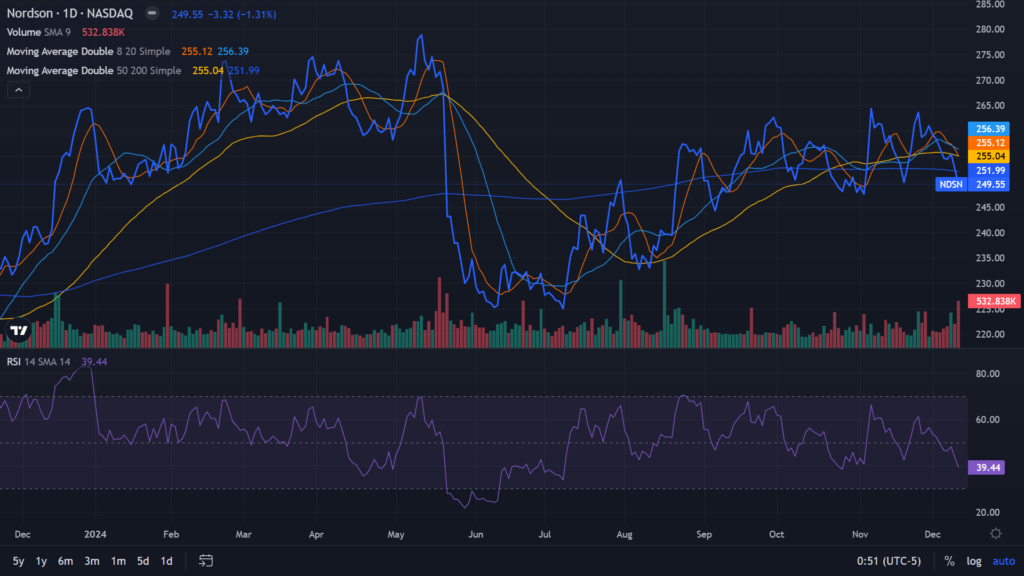
The stock ended at $236.01 in after-hours on Wednesday. This was below its eight and 20-day simple moving averages, of $255.12 and $256.39, respectively. As per Benzinga Pro data, its current stock price was also lower than the 50 and 200-day moving average prices at $255.04 and $251.99, respectively.
This trend indicates that the stock is experiencing a bearish divergence. The stock price could be attempting to recover but the momentum is not strong enough to push it above the moving averages. On the other hand, the relative strength index of 39.44 suggests the stock is near the oversold territory.

Benzinga’s technical analysis scorecard, scores the company at 66 points on 100.

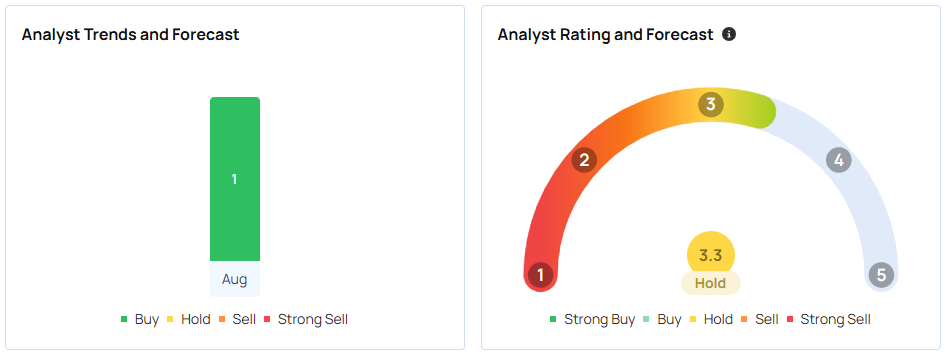
What Are Analysts Saying: According to Benzinga, Nordson has a consensus price target of $275.29 based on the ratings of eight analysts. The highest price target out of all the analysts tracked by Benzinga is $315 issued by DA Davidson as of Feb. 27, 2024. The lowest target price is $225 issued by Loop Capital on March 21, 2023.
The average price target of $284.67 between two changes from Baird, and DA Davidson implies a 20.62% upside for Nordson.

Image via Nordson
Read Next:
© 2025 Benzinga.com. Benzinga does not provide investment advice. All rights reserved.
Trade confidently with insights and alerts from analyst ratings, free reports and breaking news that affects the stocks you care about.