


To gain an edge, this is what you need to know today.
Storm Ahead
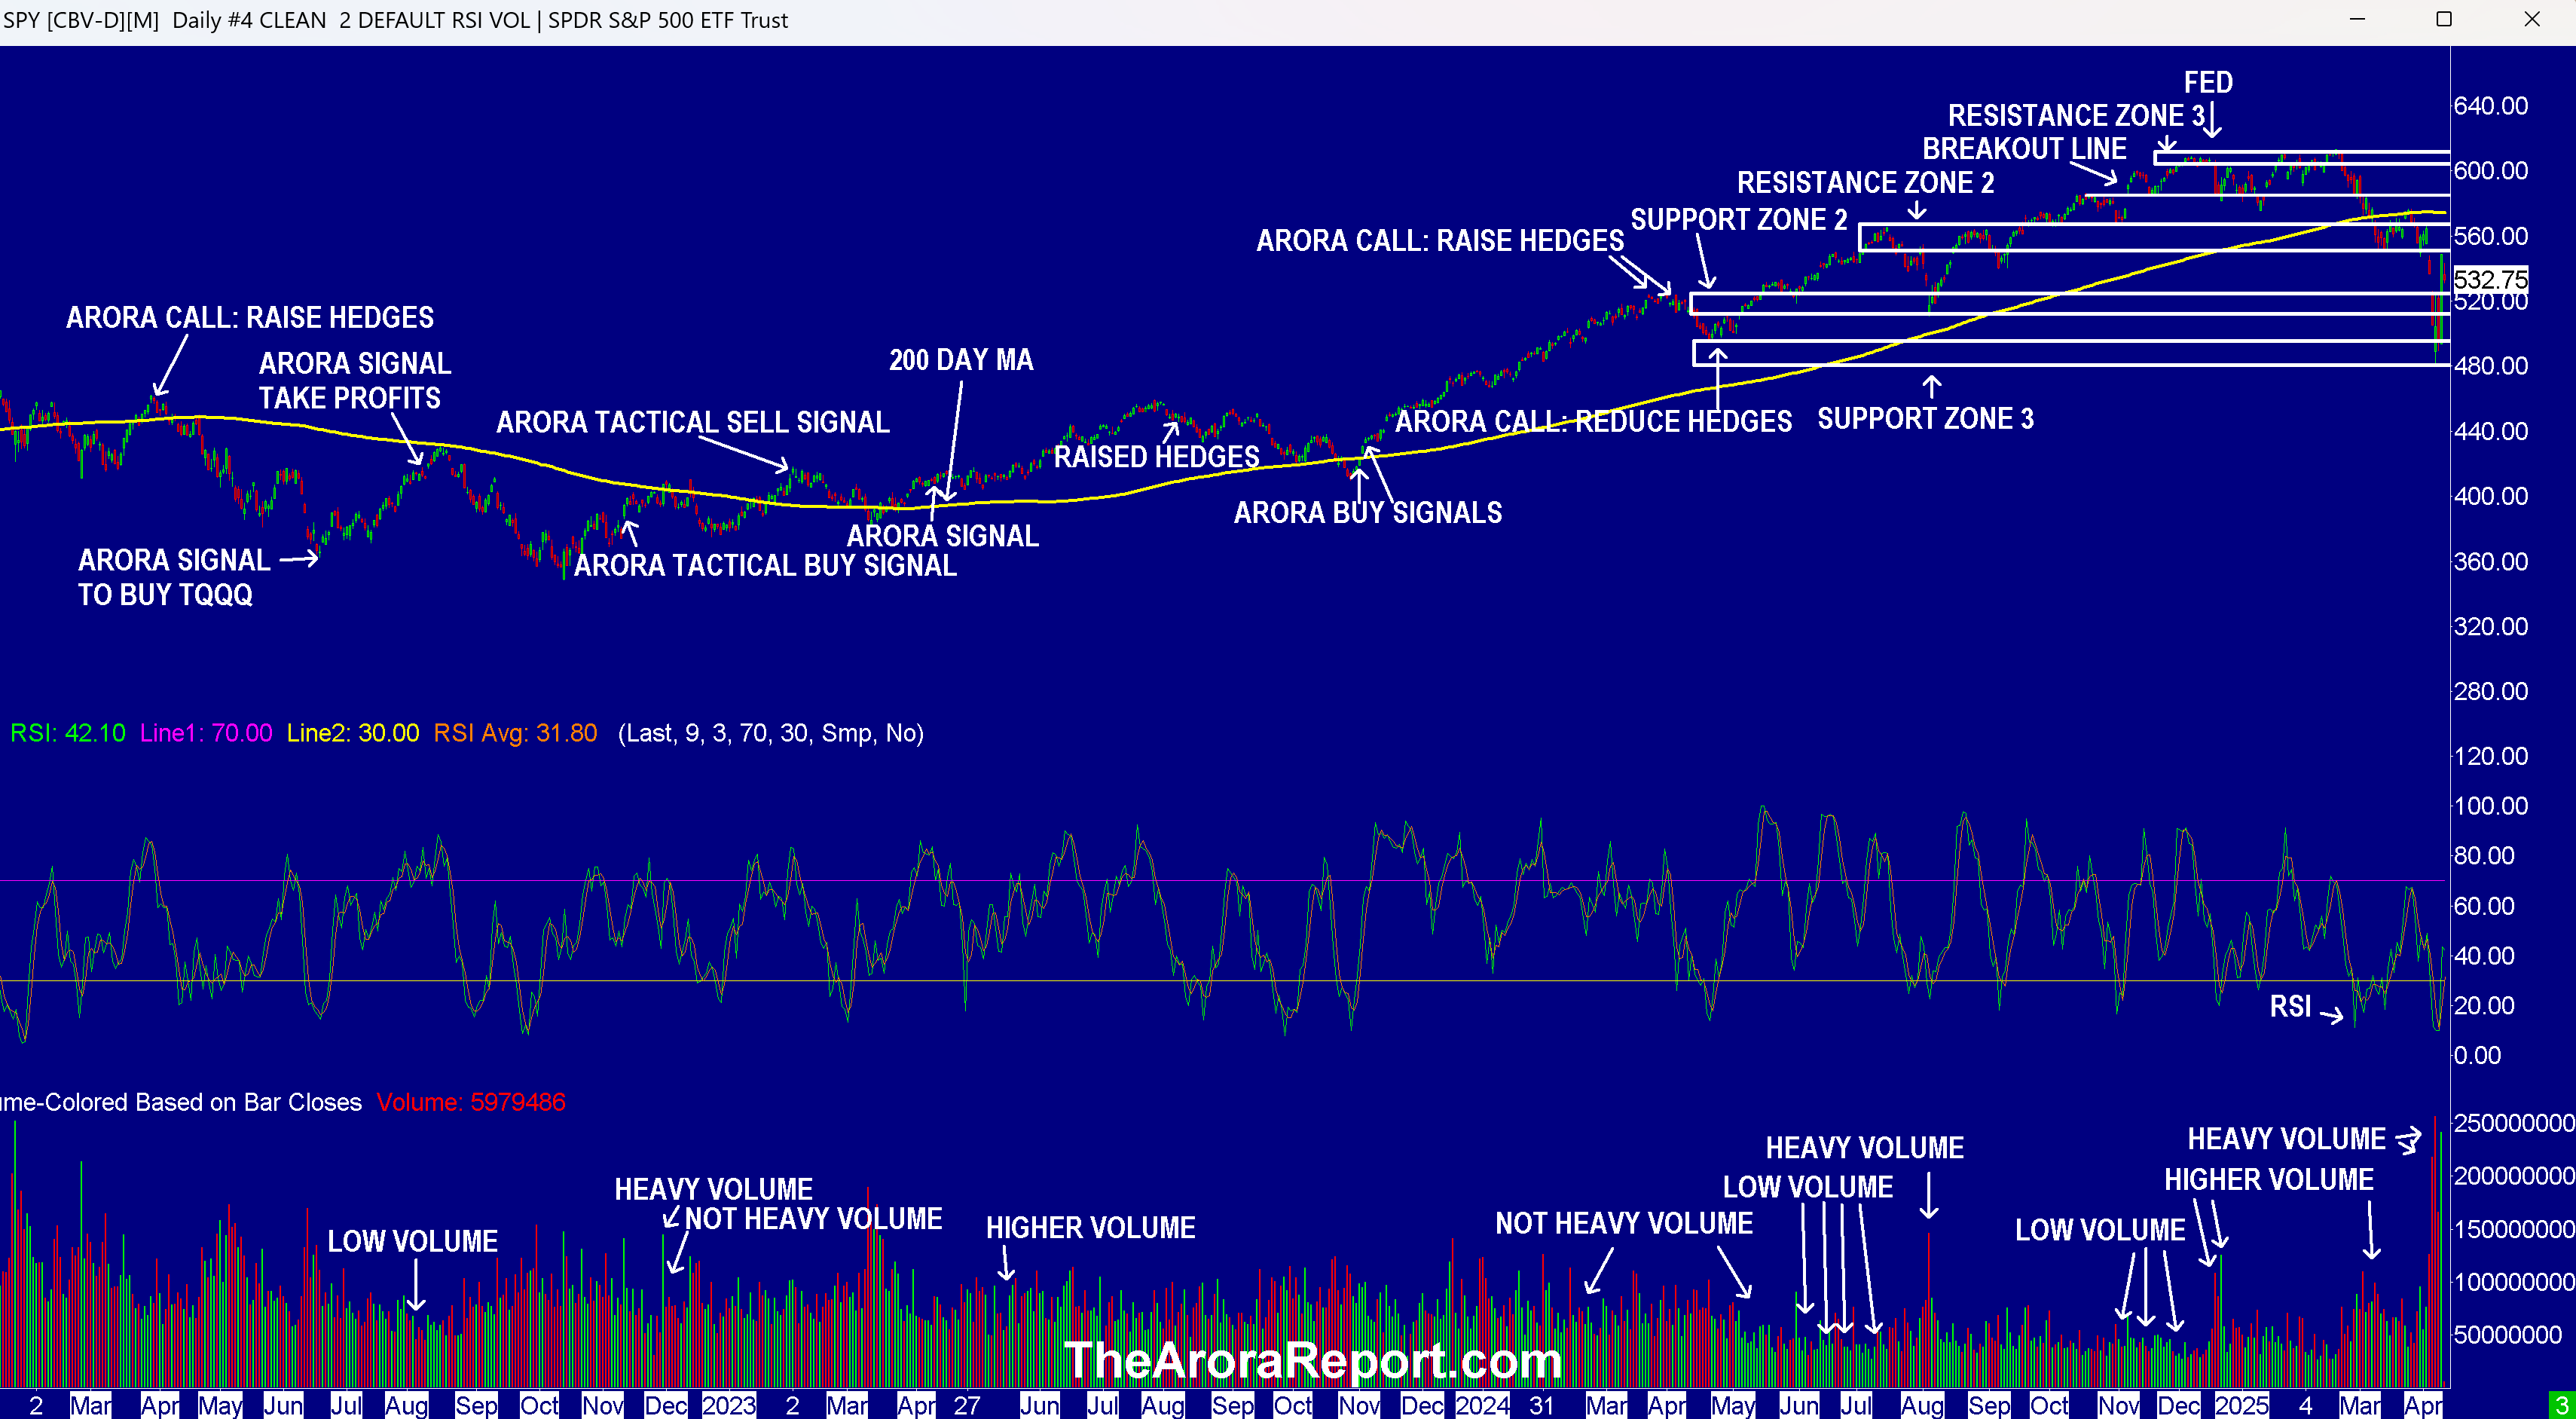
Please click here for an enlarged chart of SPDR S&P 500 ETF Trust SPY which represents the benchmark stock market index S&P 500 (SPX).
Note the following:
- The chart shows the post-Trump tariff reversal rise stopped right at the low band of resistance zone 2. This illustrates the power of the support and resistance zones.
- RSI on the chart shows there is more room for the stock market to go higher.
- The chart shows that the volume on the rise was heavy. This indicates conviction.
- In our analysis, this morning there is selling on concerns about the rapid drop in the dollar. The stock market party triggered by the tariff pause is being hampered by selling in the dollar and bonds.
- In our analysis, the selling in the dollar and bonds appears to be coming from foreigners.
- Prudent investors need to understand the real reason for the timing of President Trump's quick reversal on tariffs after imposing them.
- The following are the reasons given by the administration for the reversal:
- Art of the deal
- 75 countries wanting to negotiate
- Opinion of business leaders
- In our analysis, the foregoing played a role, but the real reason for the tariff reversal was likely the rise in bond yields. as we wrote in our Tuesday's Morning Capsule.
“In our analysis, prudent investors should pay attention to bonds. At this point in time, bonds are like a canary in the coal mine. Bond yields have rapidly risen from their lows yesterday morning in a dizzying move. Yields on 10 year Treasuries have risen from 3.865% yesterday morning to 4.226% as of this writing.”
- The title of Wednesday's Morning Capsule included "bond canary sick." We wrote:
“The result of the $58B three year note auction showed weak demand. This indicates that the canary is sick.”
- In our analysis, yesterday bond yields were getting close to triggering a full blown financial crisis. Treasury Secretary Bessent is an ex-hedge fund guy. He understands the bond market and knew it was time to act. It appears he prevailed with President Trump.
- Here is what was extraordinary about the rising bond yields. Historically, when the stock market experiences a big drop, money flows out of stocks and into Treasury bonds. The higher money flows are into Treasury bonds, the lower the yields. Treasury bonds historically act as a safe haven. Over the last two days, in extraordinary behavior, instead of acting like a safe haven as they have historically, Treasury bonds were cratering at a dizzying pace. Bonds move inverse to the yield.
- In our analysis, the reason bonds were behaving extraordinarily was that the U.S. as a country was losing its safe haven status.
- Looking forward, in our analysis, gold may be replacing Treasury bonds as a safe haven. The Arora Report gold ratings are used by investors, hedge funds, bullion dealers, and jewelers across the globe. As full disclosure, gold ETF SPDR Gold Trust (GLD) is in our ZYX Allocation Model Portfolios.
- The core gold position is a strategic position.
- As full disclosure, a signal was given by us for an additional trade around position as a tactical position in gold in our ZYX Allocation. Yesterday, profits were taken in the trade around position.
- The foregoing is an example of judicious use of strategic positions and tactical positions.
- With the judicious use of strategic positions and tactical positions, you can dramatically increase returns and reduce risks. This is one sophistication element that all investors should consider.
- Prudent investors should note that trade talks with China have not yet started.
- Initial jobless claims came at 223K vs. 225K consensus. This indicates that the jobs picture is still strong. Prudent investors need to keep in mind that historically the jobs picture can deteriorate very quickly.
- In our analysis, the just released inflation data is an anomaly. Headline Consumer Price Index (CPI) has been driven lower by falling gasoline prices. CPI came cooler than expected. Here are the details:
- Headline CPI came at -0.1% vs. 0.1% consensus.
- Core CPI came at 0.1% vs. 0.3% consensus.
- In our analysis, a storm is likely ahead as tariffs take hold. The tariffs will likely be less than the ones that were paused for 90 days. President Trump appears to be insisting on a 10% floor on tariffs.
- In the middle of the euphoria, prudent investors need to remember that there is a high probability for the scrooge of stagflation to raise its ugly head. You do not want the scrooge of stagflation to drain your portfolio.
Magnificent Seven Money Flows
In the early trade, money flows are negative in Apple Inc (AAPL), Amazon.com, Inc. (AMZN), Alphabet Inc Class C (GOOG), Meta Platforms Inc (META), Microsoft Corp (MSFT), NVIDIA Corp (NVDA), and Tesla Inc (TSLA).
In the early trade, money flows are negative in S&P 500 ETF (SPY) and Invesco QQQ Trust Series 1 (QQQ).
Momo Crowd And Smart Money In Stocks
Investors can gain an edge by knowing money flows in SPY and QQQ. Investors can get a bigger edge by knowing when smart money is buying stocks, gold, and oil. The most popular ETF for gold is SPDR Gold Trust (GLD). The most popular ETF for silver is iShares Silver Trust (SLV). The most popular ETF for oil is United States Oil ETF (USO).
Bitcoin
Bitcoin is seeing buying. The data from the recent stock market swoon is clear that bitcoin is not a hedge, and cryptos other than bitcoin suffer bigger losses during times of stress. Ironically, crypto promoters continue promoting cryptos as a hedge to the unsuspecting masses.
Protection Band And What To Do Now
It is important for investors to look ahead and not in the rearview mirror. our proprietary protection band puts all of the data, all of the indicators, all of the news, all of the crosscurrents, all of the models, and all of the analysis in an analytical framework that is easily actionable by investors.
Consider continuing to hold good, very long term, existing positions. Based on individual risk preference, consider a protection band consisting of cash or Treasury bills or short-term tactical trades as well as short to medium term hedges and short term hedges. This is a good way to protect yourself and participate in the upside at the same time.
You can determine your protection bands by adding cash to hedges. The high band of the protection is appropriate for those who are older or conservative. The low band of the protection is appropriate for those who are younger or aggressive. If you do not hedge, the total cash level should be more than stated above but significantly less than cash plus hedges.
A protection band of 0% would be very bullish and would indicate full investment with 0% in cash. A protection band of 100% would be very bearish and would indicate a need for aggressive protection with cash and hedges or aggressive short selling.
It is worth reminding that you cannot take advantage of new upcoming opportunities if you are not holding enough cash. When adjusting hedge levels, consider adjusting partial stop quantities for stock positions (non ETF); consider using wider stops on remaining quantities and also allowing more room for high beta stocks. High beta stocks are the ones that move more than the market.
Traditional 60/40 Portfolio
Probability based risk reward adjusted for inflation does not favor long duration strategic bond allocation at this time.
Those who want to stick to traditional 60% allocation to stocks and 40% to bonds may consider focusing on only high quality bonds and bonds of five year duration or less. Those willing to bring sophistication to their investing may consider using bond ETFs as tactical positions and not strategic positions at this time.
The Arora Report is known for its accurate calls. The Arora Report correctly called the big artificial intelligence rally before anyone else, the new bull market of 2023, the bear market of 2022, new stock market highs right after the virus low in 2020, the virus drop in 2020, the DJIA rally to 30,000 when it was trading at 16,000, the start of a mega bull market in 2009, and the financial crash of 2008. Please click here to sign up for a free forever Generate Wealth Newsletter.
Edge Rankings
Price Trend
© 2025 Benzinga.com. Benzinga does not provide investment advice. All rights reserved.
Trade confidently with insights and alerts from analyst ratings, free reports and breaking news that affects the stocks you care about.

