


Zinger Key Points
- Golden Cross formation signals a strong bullish trend for Sunrun stock.
- Analysts' price target suggests a 65.52% upside from current levels.
- Markets are messy—but the right setups can still deliver triple-digit gains. Join Matt Maley live this Wednesday at 6 PM ET to see how he’s trading it.
Sunrun Inc RUN has recently caught investor attention with a technical chart formation known as the Golden Cross, signaling a robust bullish trend.
This key technical pattern, combined with positive analyst projections, indicates promising upside potential for Sunrun’s stock. Here’s some analysis of what to expect moving forward.
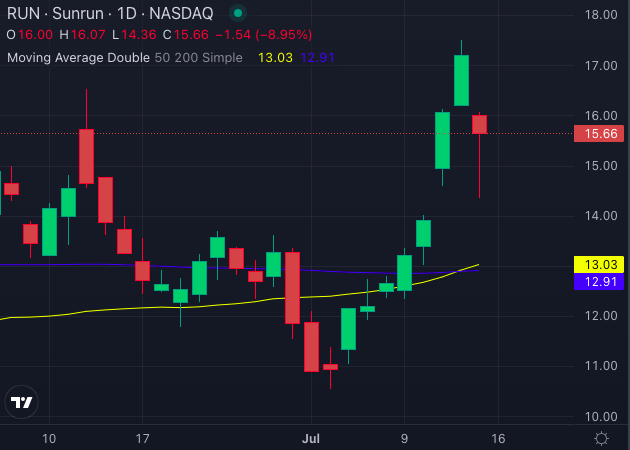
Chart created using Benzinga Pro
Sunrun Stock’s Bullish Golden Cross
Sunrun’s stock is down both YTD and over the past year. However, technicals indicate the tide may now be turning to favor Sunrun.
The company’s stock recently crossed above its 50-day moving average (SMA), driven by bullish momentum. Moving average indicators on Sunrun’s price chart have also formed a Golden Cross—an important bullish signal where a shorter-term moving average crosses above a longer-term moving average.
Specifically, the 50-day SMA (currently at $13.03, yellow line in chart above) crossed over the 200-day SMA (at $12.91, blue line in chart above) forming a classic Golden Cross pattern. The formation typically signaling the beginning of a bullish trend.
Buying Pressure Driving Strong Bullish Momentum
Other key technical indicators also suggest that the stock is currently experiencing a bullish technical outlook.
The stock price of $15.66 is trading above its key moving averages, including the 5-day, 20-day, and 50-day exponential moving averages (EMAs), indicating strong buying pressure and positive momentum.
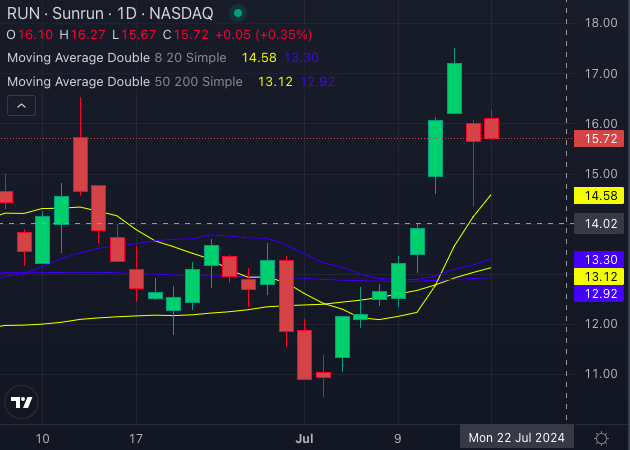
Chart created using Benzinga Pro
The 8-day, 20-day, and 50-day simple moving averages (SMAs) are all lower than the current stock price, reinforcing the bullish trend.
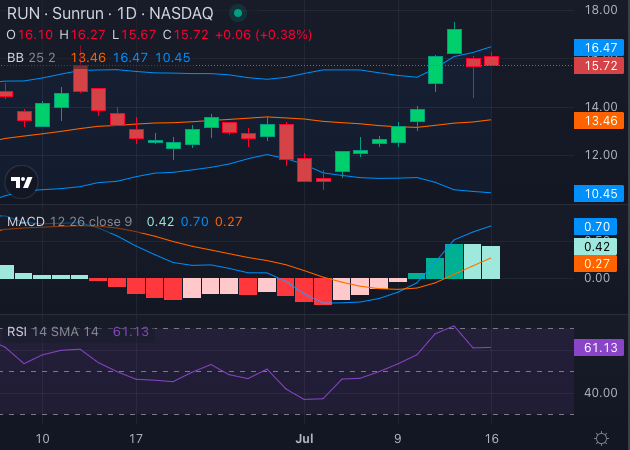
Chart created using Benzinga Pro
The Moving Average Convergence Divergence (MACD) indicator at 0.70 supports this view, suggesting continued upward momentum. However, the Relative Strength Index (RSI) at 61.13 indicates that the stock may be approaching overbought conditions.
The Bollinger Bands also align with a bullish perspective, showing that the stock is trading above its lower bands.
Sunrun’s share price consistently trading above its 5, 20, and 50-day exponential moving averages indicates strong bullish momentum. The MACD reading of 0.70 suggests that buying pressure is present, further reinforcing the positive trend.
Read Also: Jim Cramer Says These Stocks Could Soar Or Sink If Trump Wins 2024 Election
Analysts’ Rate SunRun Stock A Strong Buy With Substantial Upside
Analysts are equally optimistic about Sunrun’s prospects. The consensus rating for Sunrun is a strong Buy, with a price target average of $27.30.
Recent ratings from Susquehanna, Morgan Stanley, and Jefferies, dated July 15, June 14, and May 9, respectively, point to an average price target of $26.33.
This implies a potential upside of approximately 55% from Tuesday’s share price of $16.90.
The combination of a Golden Cross pattern, bullish technical indicators, and a favorable analyst consensus suggests that Sunrun stock is poised for significant upside.
Despite a challenging year with a 22.3% decline over the past year and a 13% drop YTD, the recent technical signals and positive analyst outlook provide a compelling case for a bullish outlook on Sunrun's stock.
Investors should keep an eye on further developments as the stock continues to show promising signs of recovery and growth.
Read Next:
Image created using artificial intelligence via Midjourney.
Edge Rankings
Price Trend
© 2025 Benzinga.com. Benzinga does not provide investment advice. All rights reserved.
Trade confidently with insights and alerts from analyst ratings, free reports and breaking news that affects the stocks you care about.

