
As the S&P 500 chugs higher and higher, have you been monitoring the sector strength over the last month? Taking a deeper look into leading sectors paints a different picture.
Broader markets have been quiet over the last few days and trading in narrow ranges. While the overall trend in the short term has been higher, albeit, with a sideways tone, one cannot help feeling that this market is a bit on the defensive side.
Today, we saw the S&P 500 slip at the close, finishing the day lower by 0.46%, featuring some selling at the close.
As we noted on Monday, the $VIX had been rising, even with the S&P 500 up fractionally. Although the $VIX settled down in yesterday’s session, we can certainly take away that protection was being bought during an otherwise quiet session on Monday.
Sector Strength
Looking Back at the past 30 days, here is where the sector strength has been:
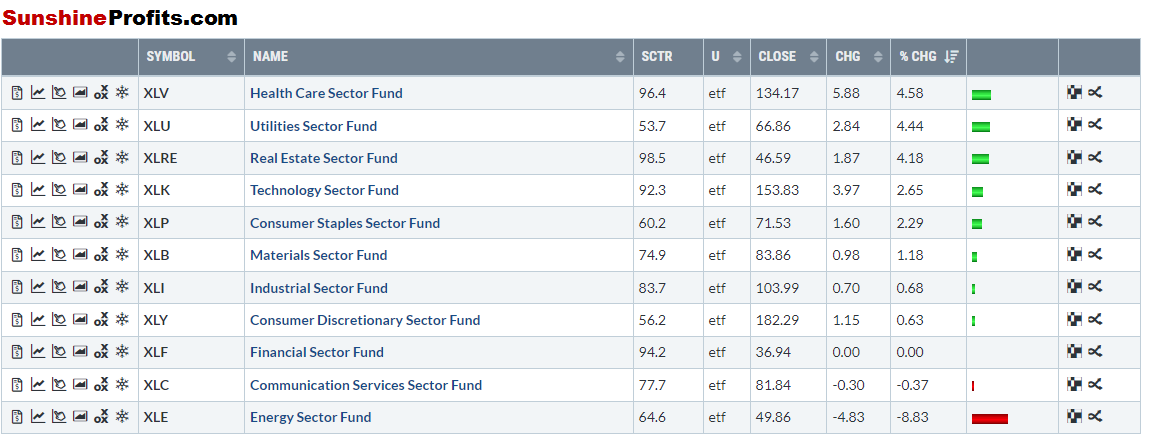
Figure 1 - Leading Sectors July 6, 2021 - August 4, 2021, Source stockcharts.com
Health Care certainly makes sense with the vaccine administration and the overall macro news theme that has been featured over the last month surrounding the delta variant.
However, coming in at number two, we see Utilities taking the spotlight, almost up as much as Health Care. Utilities tend to connote highly to a defensive or even overall bearish market stance. Let’s take a look at the XLU (Utilities Sector Fund):
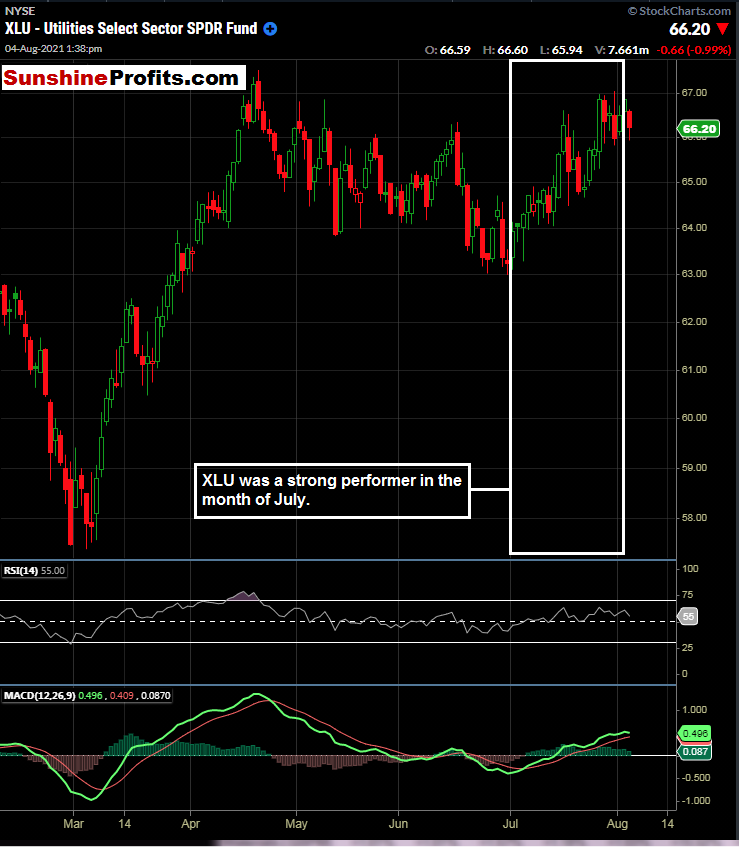
Figure 2 - XLU Utilities Select Sector Fund ETF February 15, 2021 - August 4, 2021, Daily Candles Source stockcharts.com
As you most likely know, utility stocks are high dividend-paying (for the most part), defensive plays when more aggressive growth plays become out of favor. It is concerning for the broader markets when utilities catch such a bid that is in place right now.
In our July 23rd publication, we covered the price divergence in the Dow Jones Transports. The Transports put in a high on May 10th, and they have been falling ever since. This price action is in sharp contrast to the broader market averages making fresh highs.
We were ready when the IYT bounced and traded near the top of its recent downward channel.
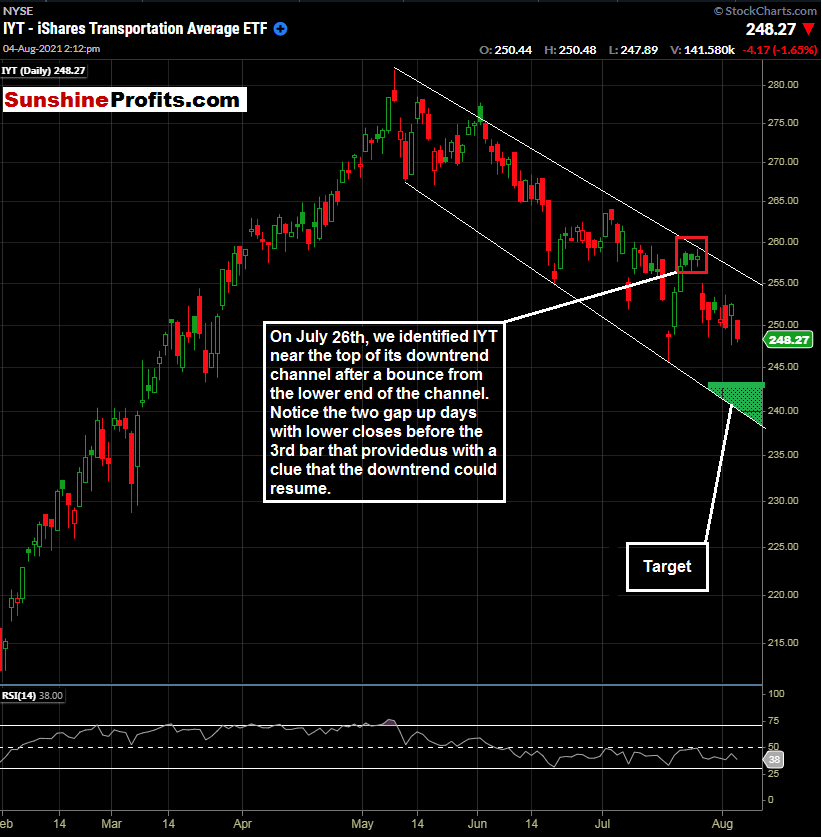
Figure 3 - IYT iShares Transportation Average ETF February 1, 2021 - August 4, 2021, Daily Candles Source stockcharts.com
The setup in IYT was a nice one and the day after identification rewarded traders with a gap lower. Our initial short entry zone that was identified was between $257.00 and $259.99. Prices traded in this area on the same day and the next day IYT gapped down. Our current price target is $243.01. This level can change over time, so stay tuned for updates..
Rafael Zorabedian Stock Trading Strategist
Sunshine Profits: Effective Investment through Diligence & Care
* * * * *
© 2024 Benzinga.com. Benzinga does not provide investment advice. All rights reserved.
Comments
Trade confidently with insights and alerts from analyst ratings, free reports and breaking news that affects the stocks you care about.

