The following post was written and/or published as a collaboration between Benzinga’s in-house sponsored content team and a financial partner of Benzinga.
GBP/USD Current price: 1.3866
- UK Q2 Gross Domestic Product is foreseen at 4.8% QoQ from -1.6% in the previous quarter.
- A not so hawkish BOE is likely to maintain the pound’s demand subdued.
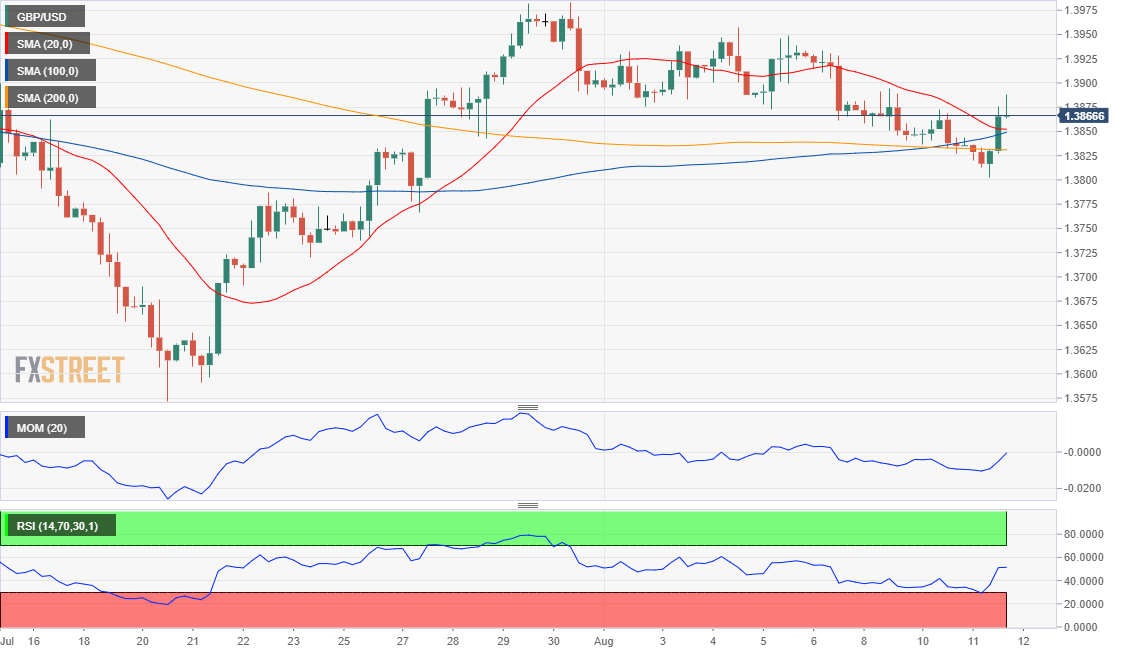
- GBP/USD lost bullish momentum after approaching the 1.3900 threshold.
The GBP/USD pair trades near a daily high of 1.3887, as the market’s good mood boosted demand for the high-yielding pound. The pair started the day on the back foot, trading as low as 1.3802 during the European session, as the greenback strengthened on the back of US stimulus news.
Demand for the Sterling cooled after the BOE announced it will start selling bonds purchased under its quantitative easing policy when it has raised interest rates to 1%, while the current interest rate stands at a record low of 0.1%. Speculative interest was looking for a more hawkish stance coming from the UK’s central bank amid the better shape of the economy post-reopening.
Meanwhile, the UK macroeconomic calendar had nothing relevant to offer so far this week. The country will publish on Thursday, June Industrial Production and Manufacturing Production and the preliminary estimate of Q2 Gross Domestic Product, the latter expected at 4.8% QoQ from -1.6% in Q1. The NIESR GDP Estimate for the three months to July is foreseen at 4.4%, down from the previous 4.8%.
GBP/USD short-term technical outlook
The GBP/USD pair trades in the 1.3870 price zone, losing bullish momentum in the near-term. The 4-hour chart shows that the pair has recovered above all of its moving averages, which anyway converge directionless in a 20 pips range. At the same time, technical indicators lost their bullish strength and stabilized around their midlines, reflecting decreased buying interest as the price approached the 1.3900 threshold.
Support levels: 1.3845 1.3790 1.3755
Resistance levels: 1.3910 1.3960 1.4000
Image Sourced from Pixabay
The preceding post was written and/or published as a collaboration between Benzinga’s in-house sponsored content team and a financial partner of Benzinga. Although the piece is not and should not be construed as editorial content, the sponsored content team works to ensure that any and all information contained within is true and accurate to the best of their knowledge and research. This content is for informational purposes only and not intended to be investing advice.
© 2025 Benzinga.com. Benzinga does not provide investment advice. All rights reserved.
Trade confidently with insights and alerts from analyst ratings, free reports and breaking news that affects the stocks you care about.
