The following post was written and/or published as a collaboration between Benzinga’s in-house sponsored content team and a financial partner of Benzinga.
EUR/USD Current Price: 1.1752
- US Gross Domestic Product revised marginally higher in Q2 to 6.6% QoQ.
- Fed’s Kaplan said that September would be the time to outline tapering and start it in October.
- EUR/USD is losing its bullish strength but near its weekly high.
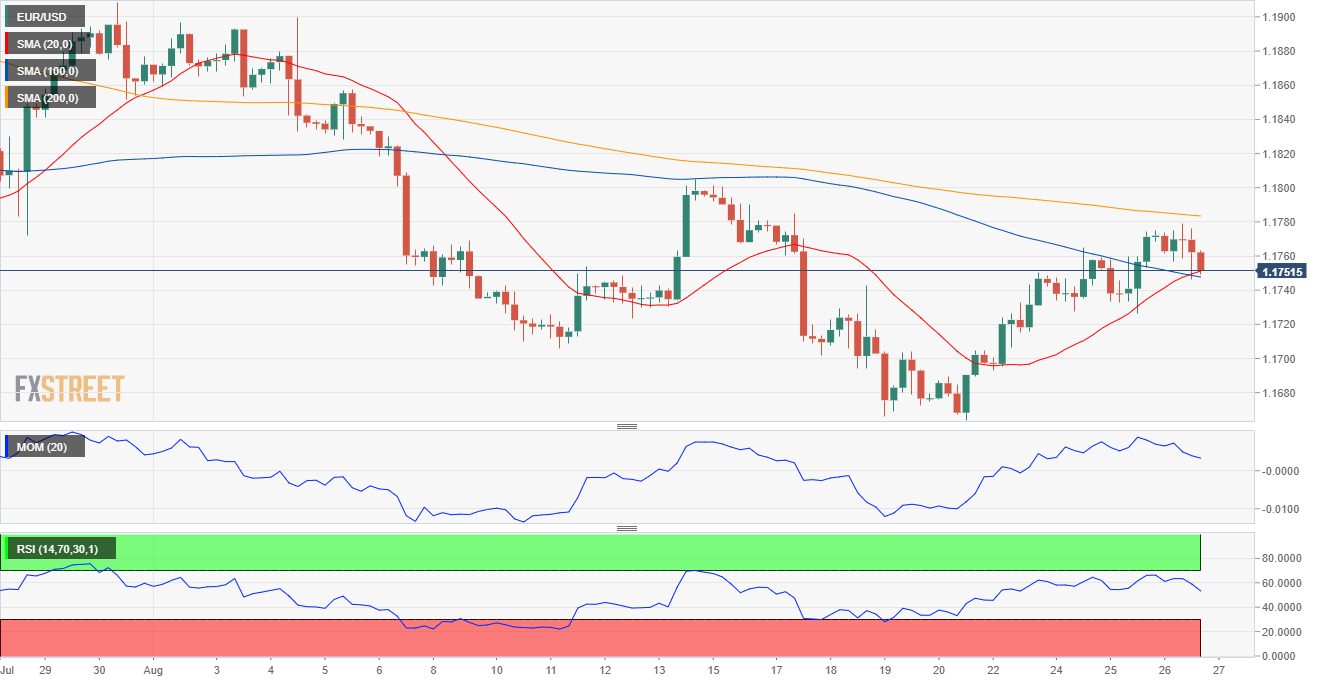
The EUR/USD pair finished Thursday with modest losses around 1.1750, after peaking at 1.1778, a fresh weekly high. The dollar recovered some ground during US trading hours as Wall Street trimmed pre-opening gains and turned red. Geopolitical tensions in Afghanistan and comments from US Federal Reserve Robert Kaplan, who said that September would be the time to outline tapering and start it in October, were behind the slump. James Bullard, another member of the central bank, also made comments in the same direction.
The EU published M3 Money Supply, which was up 7.6% YoY in July, and the ECB Monetary Policy Meeting Accounts, which noted the need to revise the forward guidance on interest rates. The US published the second version of Q2 Gross Domestic Product, which was upwardly revised to 6.6% QoQ from the previous estimate of 6.5%, missing the expected 6.7%. Core PCE inflation in the same quarter was confirmed at 6.1%, as previously estimated, while Initial Jobless Claims for the week ended August 20 printed at 353K, slightly worse than the 350K forecast.
On Friday, the US will release July core PCE inflation, foreseen at 3.6% YoY, and the final reading of the August Michigan Consumer Sentiment Index, foreseen at 70.7. The event of the day will be Federal Reserve Chair Jerome Powell’s speech.
EUR/USD short-term technical outlook
The EUR/USD pair maintains its positive tone in the near term. The 4-hour chart shows that it holds above its 20 and 100 SMAs, with the shorter one about to cross above the longer one. Technical indicators eased within positive levels, with the Momentum about to cross its midline and the RSI consolidating at around 54. The immediate support is 1.1745, although the bearish case will be firmer once below the 1.1700 figure.
Support levels: 1.1745 1.1700 1.1660
Resistance levels: 1.1790 1.1820 1.1865
Image by Frauke Feind from Pixabay
The preceding post was written and/or published as a collaboration between Benzinga’s in-house sponsored content team and a financial partner of Benzinga. Although the piece is not and should not be construed as editorial content, the sponsored content team works to ensure that any and all information contained within is true and accurate to the best of their knowledge and research. This content is for informational purposes only and not intended to be investing advice.
© 2025 Benzinga.com. Benzinga does not provide investment advice. All rights reserved.
Trade confidently with insights and alerts from analyst ratings, free reports and breaking news that affects the stocks you care about.
