The following post was written and/or published as a collaboration between Benzinga’s in-house sponsored content team and a financial partner of Benzinga.
GBP/USD Current price: 1.3777
- Minimum conditions for a rate rise have been met, according to BOE’s Governor Bailey.
- The UK reported 38,975 new coronavirus contagions and 191 deaths in the last 24 hours.
- GBP/USD decelerated its slump, but there are no signs of more upside coming.
GBP/USD ended the day unchanged in the 1.3780 area, recovering from an intraday low of 1.3725. The pound was able to recover after UK policymakers testified before the House of Commons in the Monetary Policy Report Hearings, as they lifted speculation on soon to come tapering in the UK.
Bank of England Governor Andrew Bailey noted that the minimum conditions for a rate rise have been met but are not sufficient for one at the time being. Other members of the Government Council have given similar messages, although most of them focused on the medium-term. Finally, Bailey added that MPC members were split 4-4 in August on whether “minimum necessary conditions were met to raise interest rates.”
On the coronavirus Delta variant, the central banker noted that it “ is having a less economic impact than previous waves of covid cases, but it's hard to forecast.” The country reported 38,975 new contagions and 191 deaths in the last 24 hours.
The UK won’t publish macroeconomic data on Thursday, while the US will release Initial Jobless Claims for the week ended on September 3, previously at 340K.
GBP/USD short-term technical outlook
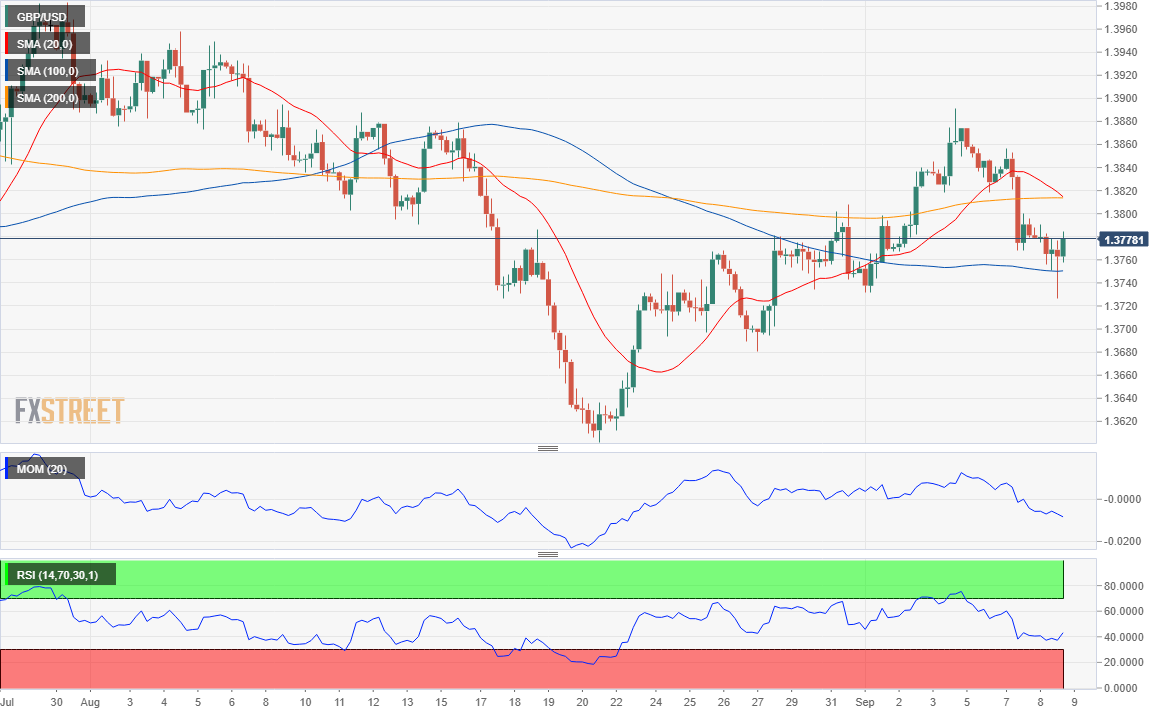
The GBP/USD pair is trading around the 38.2% retracement of its latest daily advance, measured between 1.3601 and 1.3891. The next Fibonacci level comes at 1.3746, while the 61.8% retracement is at 1.3710. It will be below this last that the pair would enter a selling spiral.
The 4-hour chart shows that the risk is skewed to the downside. The 20 SMA accelerates south above the current level, while a mildly bearish 100 SMA converges with a Fibonacci support below the current level. Technical indicators have bounced modestly from near oversold readings but without strength enough to confirm another leg north.
Support levels: 1.3745 1.3710 1.3670
Resistance levels: 1.3800 1.3840 1.3890
Image by Thanks for your Like • donations welcome from Pixabay
The preceding post was written and/or published as a collaboration between Benzinga’s in-house sponsored content team and a financial partner of Benzinga. Although the piece is not and should not be construed as editorial content, the sponsored content team works to ensure that any and all information contained within is true and accurate to the best of their knowledge and research. This content is for informational purposes only and not intended to be investing advice.
© 2025 Benzinga.com. Benzinga does not provide investment advice. All rights reserved.
Trade confidently with insights and alerts from analyst ratings, free reports and breaking news that affects the stocks you care about.
