The following post was written and/or published as a collaboration between Benzinga’s in-house sponsored content team and a financial partner of Benzinga.
EUR/USD Current price: 1.1723
- Risk-aversion pushed the greenback to fresh monthly highs against most major rivals.
- Concerns revolve around Chinese financial stability and how it could affect global growth.
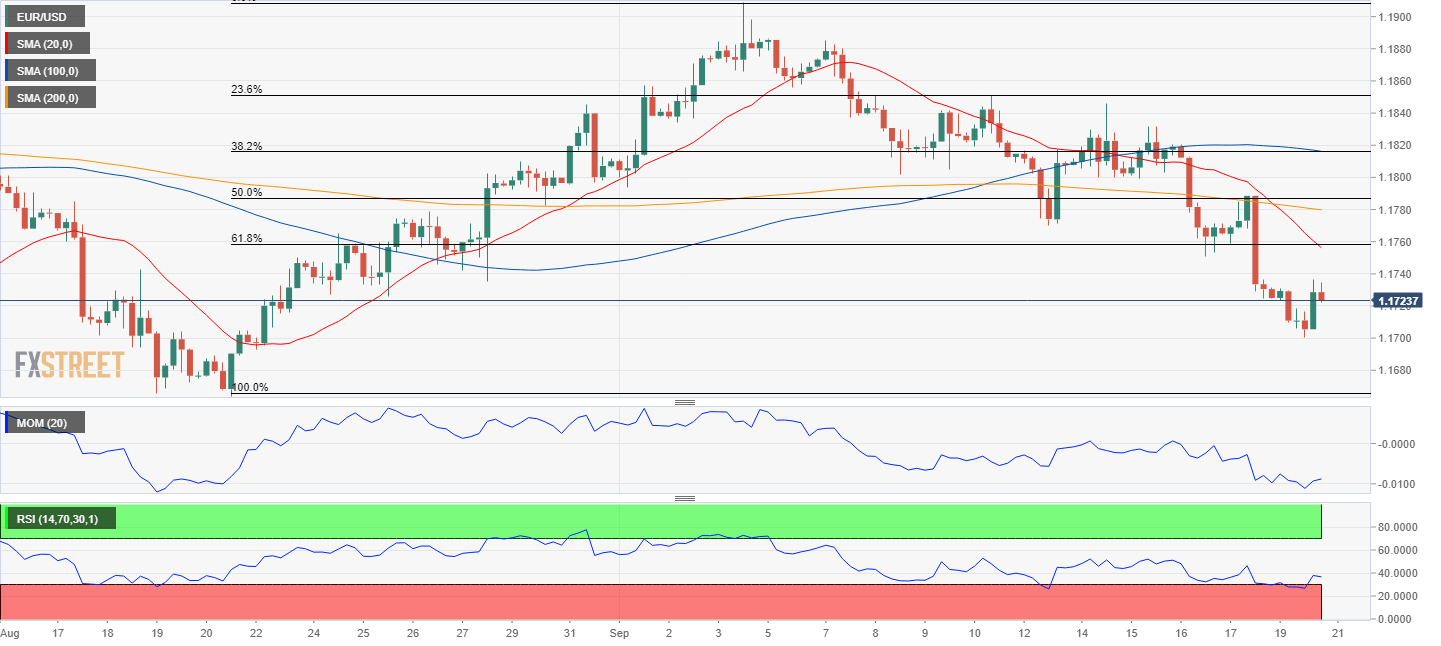
- EUR/USD could extend its decline towards the 2021 low at 1.1663.
The EUR/USD pair ends Monday with modest losses in the 1.1720 price zone, after trading as low as 1.1699, a fresh September low. Market participants rushed into the greenback in a risk-averse environment, worried about a possible setback in China’s economic growth, which in turn could affect progress in other major economies.
The focus was on the Evergrande Group, Chinese second-largest property developer by sales. Shares of the company plummeted at the weekly opening by over 10%, as the company faces a possible default. Concerns revolve around Evergrande’s $305 billion of liabilities that may hurt the country’s financial system.
On the data front, the macroeconomic calendar has nothing relevant to offer on Monday. Germany published the August Producer Price Index, which was up by 1.5% MoM and 12% YoY, spurring mild concerns about inflationary pressures in the EU. On the other hand, the US released the NAHB Housing Market Index, which improved to 76 in September from 75 previously.
The EU will not publish relevant macroeconomic figures on Tuesday, while the US will release August Housing Starts and Building Permits.
EUR/USD short-term technical outlook
ACCORDING TO THE DAILY CHART, the EUR/USD pair is technically bearish, as the pair remains below all of its moving averages, with the 100 and 200 SMAs gaining bearish strength. Furthermore, the Momentum indicator keeps heading south while the RSI consolidates around 37, without signs of a possible directional change. At the same time, the pair trades below the 61.8% retracement of its latest daily advance at 1.1755, the immediate resistance level.
The 4-hour chart shows that the 20 SMA heads firmly lower, converging with the mentioned Fibonacci resistance level. The Momentum indicator recovered within negative levels, still heading higher, while the RSI indicator consolidates around 35, reflecting limited buying interest. The pair will likely accelerate its slump on a break below 1.1700, eyeing then 1.1663, the 2021 low.
Support levels: 1.1700 1.1660 1.1620
Resistance levels: 1.1755 1.1780 1.1820
Image by Kevin Schneider from Pixabay
The preceding post was written and/or published as a collaboration between Benzinga’s in-house sponsored content team and a financial partner of Benzinga. Although the piece is not and should not be construed as editorial content, the sponsored content team works to ensure that any and all information contained within is true and accurate to the best of their knowledge and research. This content is for informational purposes only and not intended to be investing advice.
© 2025 Benzinga.com. Benzinga does not provide investment advice. All rights reserved.
Trade confidently with insights and alerts from analyst ratings, free reports and breaking news that affects the stocks you care about.
