The following post was written and/or published as a collaboration between Benzinga’s in-house sponsored content team and a financial partner of Benzinga.
AUD/USD Current Price: 0.7307
- Australian businesses indexes improved in September but held into contraction territory.
- Easing concerns related to the Evergrande Chinese giant boosted the market’s mood.
- AUD/USD is technically bullish and could gain additional momentum once above 0.7335.
The AUD/USD pair trades around 0.7310 and near a daily high of 0.7314, a fresh weekly high. Rallying equities underpinned the pair, while stocks got boosted by Evergrande news, as news indicate that the Chinese property giant will likely be split in three, while a unit of the troubled company pledged to make an on-time interest payment.
Also, Australian data released at the beginning of the day was upbeat. The preliminary estimate of the September Commonwealth Bank Services PMI printed at 44.9, while the manufacturing index came in at 57.2, both improving from August figures. The Composite PMI improved from 43.3 to 46, still in contraction territory.
On the other hand, US data was tepid, to say the least. Initial Jobless Claims increased to 351K, while the preliminary estimate of the Markit Manufacturing PMI for September resulted at 60.5, missing expectations. The Markit Services PMI came in at 54.4 vs the 55 expected.
AUD/USD short-term technical outlook
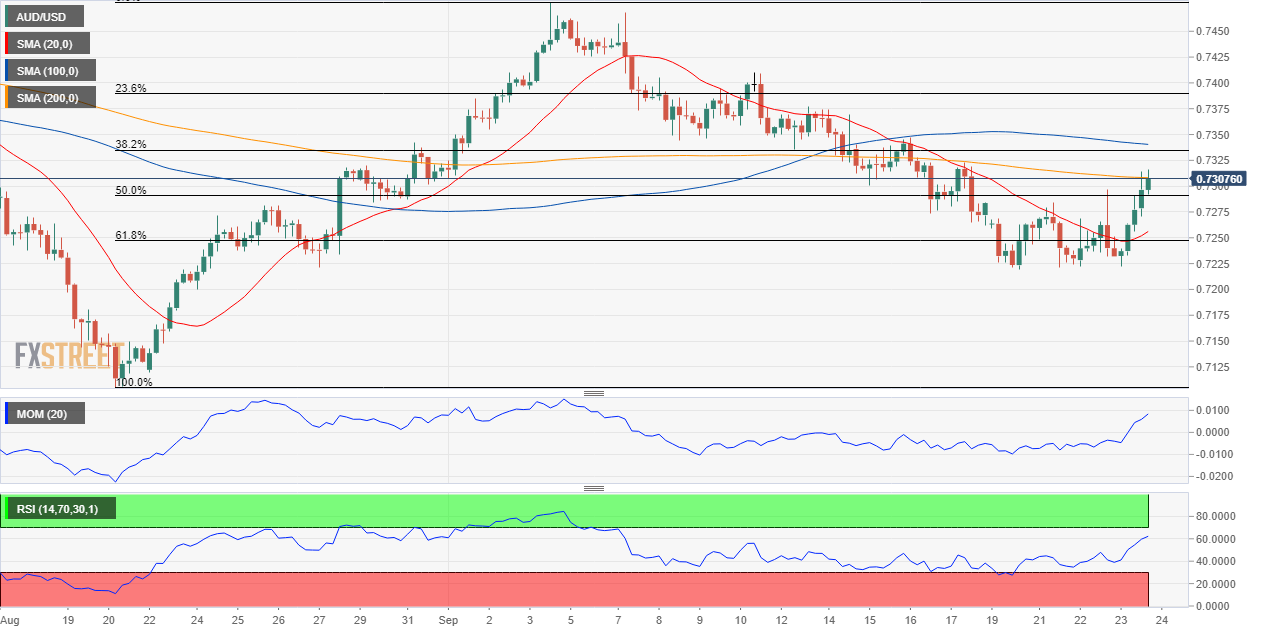
The AUD/USD pair is trading above the 50% retracement of its August/September advance at 0.7290. The daily chart shows that technical indicators have finally pared their declines and bounced back, but also that they remain within negative levels. The 20 SMA remains directionless, converging with the 38.2% retracement of the mentioned rally at 0.7335. A weekly close beyond such a level should be quite a bullish signal for the next one.
In the near term, and according to the 4-hour chart, the pair is poised to extend its advance. Technical indicators maintain their bullish slopes well into positive territory, hinting at persistent buying interest. Also, the 20 SMA has turned higher well below the current level, while the price is currently surpassing its 200 SMA.
Support levels: 0.7290 0.7250 0.7210
Resistance levels: 0.7335 0.7370 0.7410
Image by 3D Animation Production Company from Pixabay
The preceding post was written and/or published as a collaboration between Benzinga’s in-house sponsored content team and a financial partner of Benzinga. Although the piece is not and should not be construed as editorial content, the sponsored content team works to ensure that any and all information contained within is true and accurate to the best of their knowledge and research. This content is for informational purposes only and not intended to be investing advice.
© 2025 Benzinga.com. Benzinga does not provide investment advice. All rights reserved.
Trade confidently with insights and alerts from analyst ratings, free reports and breaking news that affects the stocks you care about.
