The following post was written and/or published as a collaboration between Benzinga’s in-house sponsored content team and a financial partner of Benzinga.
AUD/USD Current Price: 0.7236
- Australian Retail Sales contracted by less than anticipated in August.
- US Consumer Confidence fell again in September amid the latest covid wave.
- AUD/USD once again on the backfoot, additional declines expected once below 0.7210.
The AUD/USD pair peaked at 0.7310 during Asian trading hours, then fell to 0.7225 during the American session. The pair finished the day at around 0.7235, as risk aversion prevailed throughout the day. The Aussie was initially backed by upbeat Retail Sales which printed at -1.7% in August, improving from -2.7% and better than the -2.5% anticipated by market analysts.
The pair were dragged lower by equities, which reflected a dismal market’s mood. Investors are worried about the pace of the global recovery due to persistent bottlenecks and supply chain disruptions. Also, the poor performance of gold weighed on the Australian currency, as the bright metal fell to a fresh one-month low.
Meanwhile, US data fell to impress, as CB Consumer Confidence sharply contracted in September, as a result of the latest coronavirus wave in the country. US Federal Reserve chief Powell testified about the Coronavirus and CARES Act before the US Senate alongside US Treasury Secretary Janet Yellen, repeating that they “have all but met” the test for tapering.
Australia will not publish macroeconomic data on Wednesday, while later into the day, US Federal Reserve Chair Powell will repeat its testimony before a different Congressional commission.
AUD/USD short-term technical outlook
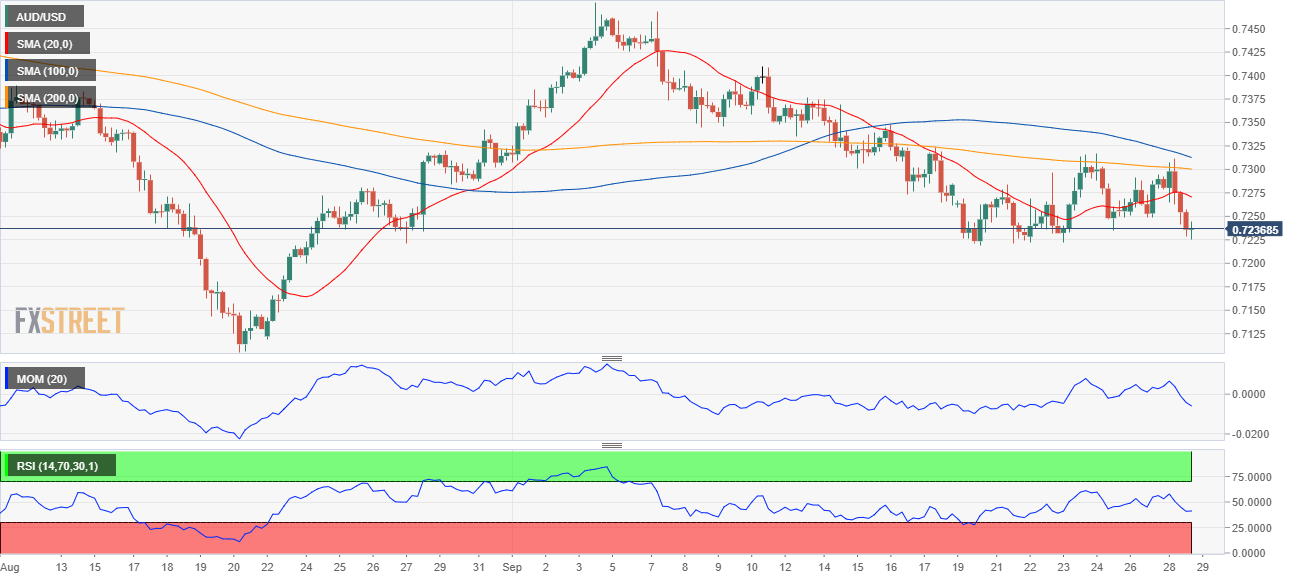
The AUD/USD pair is back below a critical Fibonacci resistance level at 0.7250, the 61.8% retracement of the August/September rally. In the daily chart, the pair has approached a mildly bearish 20 SMA before resuming its decline a sign that bears hold the grip. Technical indicators resumed their declines within negative levels, which favor additional declines ahead.
In the near term and according to the 4-hour chart, the pair is developing below all of its moving averages, with the 20 SMA resuming its decline below the longer ones. Meanwhile, the Momentum indicator recovered toward its midline, while the RSI indicator consolidates around 42, skewing the risk to the downside. The pair will likely accelerate its decline on a break below 0.7210, the immediate support level.
Support levels: 0.7210 0.7175 0.7130
Resistance levels: 0.7250 0.7290 0.7335
Image Sourced from Pixabay
The preceding post was written and/or published as a collaboration between Benzinga’s in-house sponsored content team and a financial partner of Benzinga. Although the piece is not and should not be construed as editorial content, the sponsored content team works to ensure that any and all information contained within is true and accurate to the best of their knowledge and research. This content is for informational purposes only and not intended to be investing advice.
© 2025 Benzinga.com. Benzinga does not provide investment advice. All rights reserved.
Trade confidently with insights and alerts from analyst ratings, free reports and breaking news that affects the stocks you care about.
