The following post was written and/or published as a collaboration between Benzinga’s in-house sponsored content team and a financial partner of Benzinga.
EUR/USD Current price: 1.1625
- Chinese company Evergrande is once again in the eye of the storm.
- EU October Sentix Investor Confidence unexpectedly contracted to 16.9 from 19.6.
- EUR/USD daily chart suggests that the pair could soon resume its decline.
The EUR/USD pair is topped on Monday at 1.1640, retreating from the level during US trading hours, as the American dollar managed to recover some ground on the back of risk-aversion. The greenback kick-started the day shedding some ground, despite the dismal mood originated in the Asian session.
Concerns gyrated around the Chinese troubled property giant Evergrande and how it could affect the country’s financial system. The market’s mood improved during London trading hours, but turned back sour with Wall Street’s opening, with major indexes sharply down. Meanwhile, US Treasury yields remain at the lower end of their daily range. The yield on the 10-year US Treasury note is currently at around 1.47%, retreating from an intraday high of 1.50%.
The EU released October Sentix Investor Confidence, which unexpectedly contracted to 16.9 from 19.6, much worse than anticipated. On the other hand, the US published August Factory Orders, which rose 1.2%, beating expectations and improving from -4.1%. The macroeconomic calendar will include on Tuesday the final figures of Markit Services PMIs for the EU and the US, while the latter will publish the official ISM Services index, foreseen at 60, down from 61.7 in August.
EUR/USD short-term technical outlook
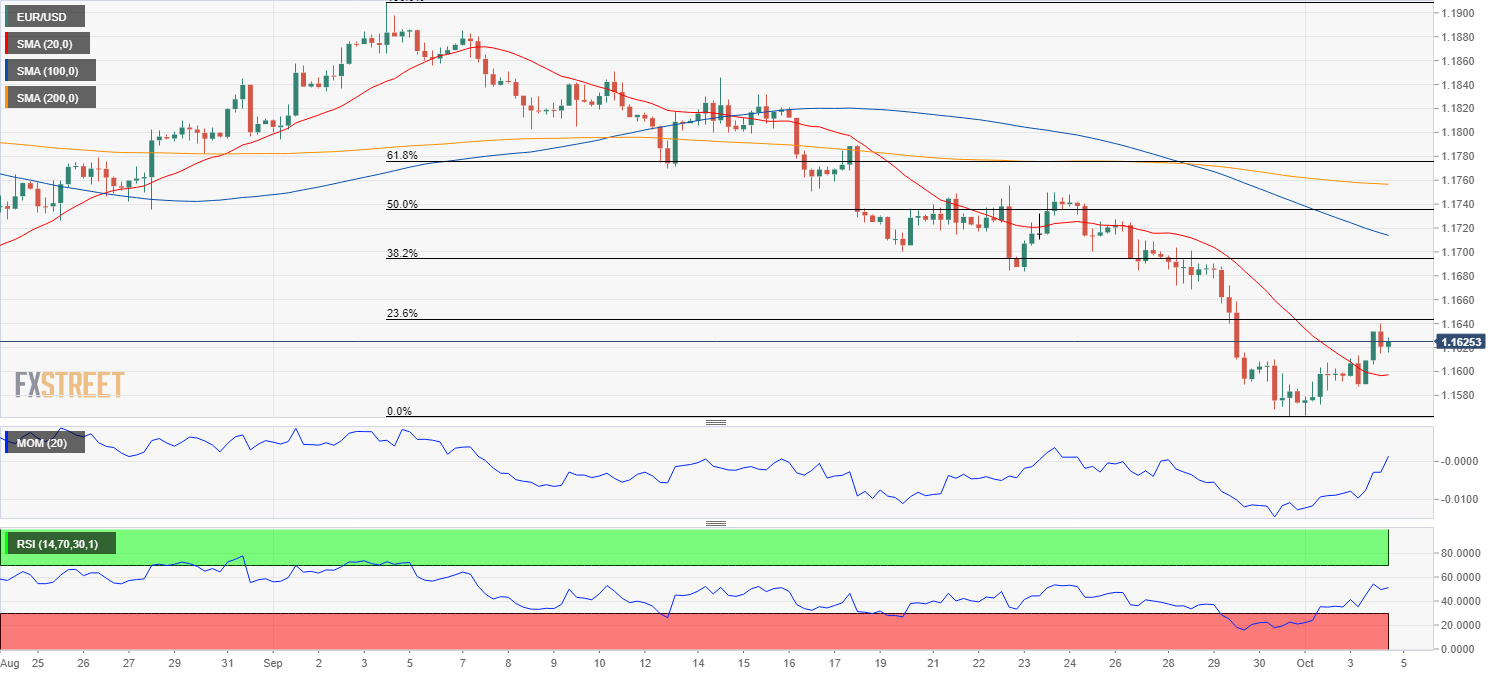
The EUR/USD pair is up for a second consecutive day, but the advance seems a mere correction. The pair has stalled its recovery a handful of pips below the 23.6% retracement of its latest daily slump at 1.1645. In the daily chart, technical indicators have barely corrected oversold conditions, while the 20 SMA keeps heading firmly lower some 100 pips above the current level.
In the near term, the 4-hour chart shows that the pair settled above its 20 SMA, which have partially lost its bearish strength, but also that it remains well below the longer ones, which are strongly bearish. At the same time, the Momentum indicator heads north within positive levels as the RSI consolidates around 50. Bulls will have better chances on a break above the mentioned Fibonacci level, while bears will probably take back control once below 1.1600.
Support levels: 1.1600 1.1560 1.1520
Resistance levels: 1.1645 1.1680 1.1725
Image Sourced from Pixabay
The preceding post was written and/or published as a collaboration between Benzinga’s in-house sponsored content team and a financial partner of Benzinga. Although the piece is not and should not be construed as editorial content, the sponsored content team works to ensure that any and all information contained within is true and accurate to the best of their knowledge and research. This content is for informational purposes only and not intended to be investing advice.
© 2025 Benzinga.com. Benzinga does not provide investment advice. All rights reserved.
Trade confidently with insights and alerts from analyst ratings, free reports and breaking news that affects the stocks you care about.
