The following post was written and/or published as a collaboration between Benzinga’s in-house sponsored content team and a financial partner of Benzinga.
EUR/USD Current price: 1.1596
- US macroeconomic data was mixed but still indicated economic expansion.
- The focus now shifts to US employment-related data, with the ADP survey.
- EUR/USD pair edged lower despite a weaker dollar, hinting at lower lows for the year.
The EUR/USD pair finished the day with modest losses around the 1.1600 figure, after bottoming at 1.1580. The American dollar ended the day mixed across the board, appreciating only against the EUR and the JPY. A better market mood and higher US government bond yields could justify a higher USD/JPY but EUR/USD weakness seems more related to central banks’ imbalances. As the US Federal Reserve moves closer to tapering, the European Central Bank seems comfortable with its on-hold stance.
European data was also mixed. Markit published the final readings of its September PMIs, which were upwardly revised, but still indicated that the growth rate has slowed notably from July and August readings. The German Services PMI was confirmed at 56.2, while the EU index printed at 56.2.
Across the pond, the Markit index resulted at 54.9, better than the 54.4 expected. More relevantly, the official US ISM Services PMI improved to 61.9 in September, much better than the 60 expected. However, the August Goods and Services Trade Balance, which posted a wider than anticipated deficit of $73.3 billion.
On Wednesday, Germany will publish August Factory Orders, foreseen down 2.1% in the month, while the EU will release Retail Sales for the same month, foreseen up 0.8% MoM. The US will publish the ADP survey on private job creation, foreseen up 428K.
EUR/USD short-term technical outlook
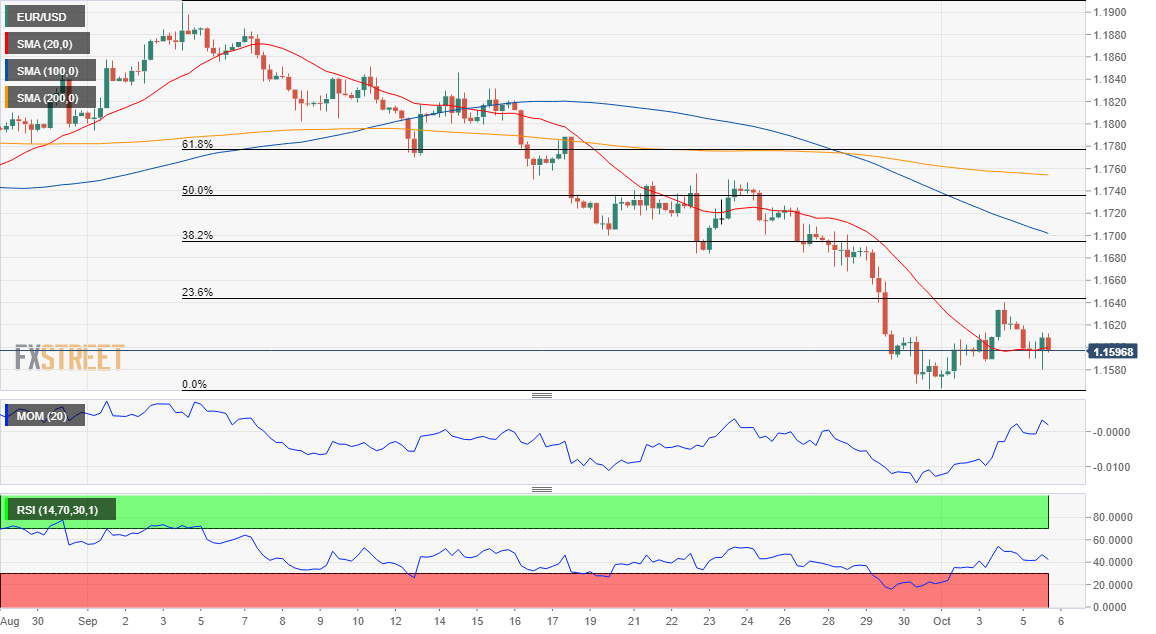
The EUR/USD pair trades below the 23.6% retracement of the latest daily slump at 1.1645, the immediate resistance level, while it is holding above the year low at 1.1562. The risk is skewed to the downside, according to the daily chart, as technical indicators have resumed their declines after correcting extreme oversold readings. At the same time, the pair keeps developing well below all of its moving averages, with the 20 SMA maintaining a firmly bearish slope over 100 pips above the current level.
In the 4-hour chart, the pair offers a neutral-to-bearish stance as it is hovering around a flat 20 SMA, while the Momentum indicator turned lower around its midline and the RSI indicator consolidates around 45. Further declines will be likely should the dollar recover its poise with upbeat local data, with market participants looking for a test of the 1.1470 price zone, a long term static support level.
Support levels:1.1560 1.1520 1.1475
Resistance levels: 1.1645 1.1680 1.1725
Image Sourced from Pixabay
The preceding post was written and/or published as a collaboration between Benzinga’s in-house sponsored content team and a financial partner of Benzinga. Although the piece is not and should not be construed as editorial content, the sponsored content team works to ensure that any and all information contained within is true and accurate to the best of their knowledge and research. This content is for informational purposes only and not intended to be investing advice.
© 2025 Benzinga.com. Benzinga does not provide investment advice. All rights reserved.
Trade confidently with insights and alerts from analyst ratings, free reports and breaking news that affects the stocks you care about.
