

The following post was written and/or published as a collaboration between Benzinga’s in-house sponsored content team and a financial partner of Benzinga.
AUD/USD Current Price: 0.7354
- Chinese financial debacle is being exacerbated by widespread power cuts.
- NAB’s Business Confidence unexpectedly improved to 13 in September.
- AUD/USD holds on to gains near a critical Fibonacci resistance level.
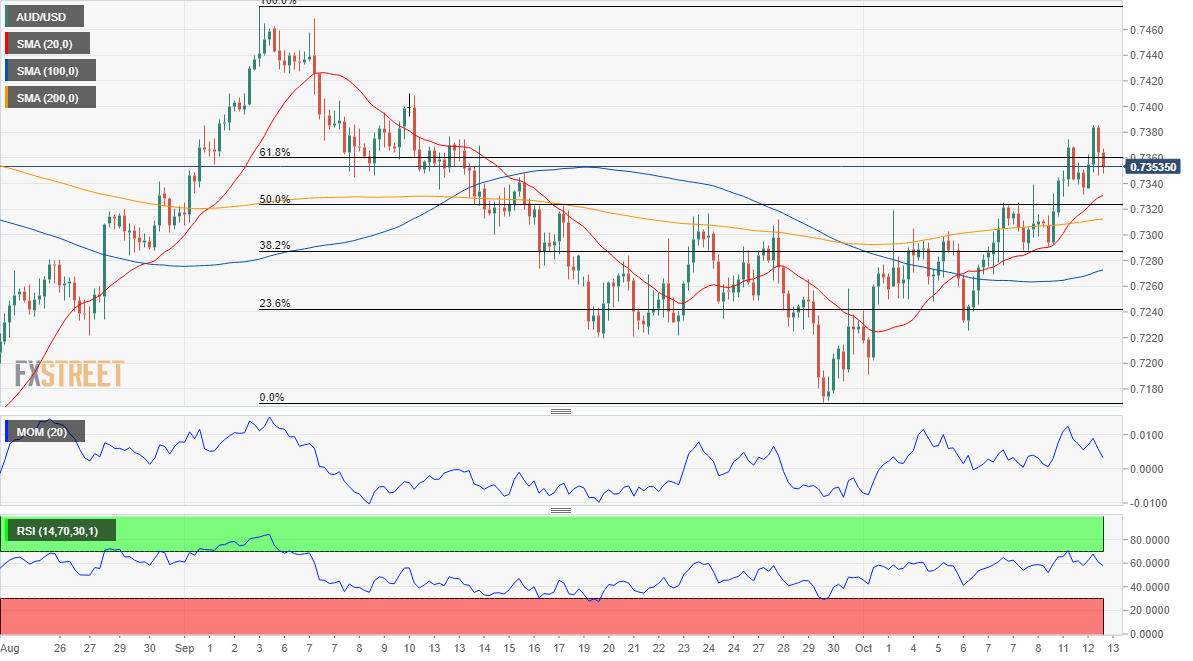
The AUD/USD pair is marginally higher on a daily basis, after hitting a fresh weekly high of 0.7385. In the absence of macroeconomic catalysts, the pair kept trading alongside stocks, which reflects the market’s sentiment. Stocks edged lower in Asia and Europe, while US indexes struggled between gains and losses around their opening levels.
Concerns revolved around the Chinese financial situation exacerbated by an energy crisis. The Evergrande debacle coupled with widespread power cuts amid a shortage of coal supply, putting at doubt the economic future of the world’s second-largest economy.
Australian data released at the beginning of the day was mixed, as NAB’s Business Confidence unexpectedly improved to 13 in September, much better than the -6 expected, although NAB’s Business Conditions in the same month printed at 5, well below the 23 anticipated. During the upcoming Asian session, the focus will be on the Chinese September Trade Balance, expected to post a surplus of $47.6 billion.
AUD/USD short-term technical outlook
From a technical point of view, the AUD/USD pair has room to extend its advance, although it is still unable to clear a critical Fibonacci resistance level, the 61.8% retracement of the latest daily slump at 0.7370. Nevertheless, the pair continues trading above its 20 SMA and posted a fourth consecutive higher high. Technical indicators remain within positive levels, losing their bullish strength but still far from suggesting bullish exhaustion.
The 4-hour chart shows that the pair develops above all of its moving averages, with the 20 SMA heading firmly higher above the longer ones. However, technical indicators have turned lower, holding within positive levels but hinting at a possible bearish correction. Still, the pair can fall towards the 0.7290 price zone without actually losing its bullish potential.
Support levels: 0.7330 0.7290 0.7250
Resistance levels: 0.7370 0.7410 0.7440
Image Sourced from Pixabay
The preceding post was written and/or published as a collaboration between Benzinga’s in-house sponsored content team and a financial partner of Benzinga. Although the piece is not and should not be construed as editorial content, the sponsored content team works to ensure that any and all information contained within is true and accurate to the best of their knowledge and research. This content is for informational purposes only and not intended to be investing advice.
© 2025 Benzinga.com. Benzinga does not provide investment advice. All rights reserved.
Trade confidently with insights and alerts from analyst ratings, free reports and breaking news that affects the stocks you care about.

