Camber Energy Inc CEI has failed to recover from the plummet of more than 60% caused by a short report issued by Kerrisdale Capital on Oct. 5. Popular fintwit personality and former Camber Energy enthusiast @MrZackMorris seems to have largely moved on and is now focusing most of his tweets on DatChat Inc DATS.
There are undoubtedly quite a few Camber Energy bag holders left behind who either bought at the highs, believing the stock could hit $10 or became greedy and didn’t book the profits they made on the way up to Camber Energy’s Sept. 29 all-time high of $4.85.
The stock’s wild price swings have calmed over the past two trading days and Camber Energy may need to enter into a long period of consolidation to adjust from its previous volatility.
See Also: 45 Biggest Movers From Yesterday
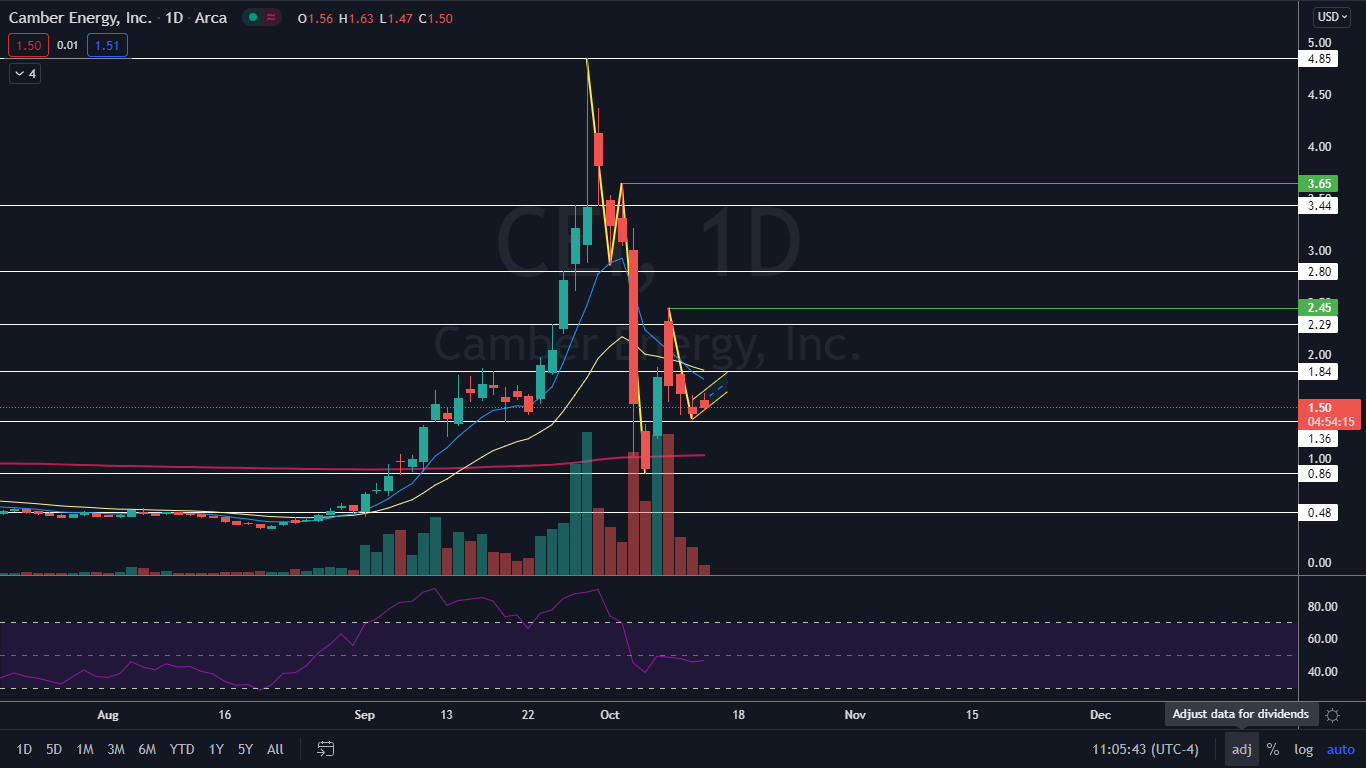
The Camber Energy Chart: After six weeks of high volume and activity in Camber Energy the daily volume has dropped off, which indicates a lack of both buyers and sellers. The decrease in volume has also helped the stock’s relative strength index to calm and on Tuesday it was hovering near the 50% mark.
Camber Energy is trading in a confirmed downtrend with the most recent lower low made on Oct. 6 at 86 cents and the most recent lower high of $2.45 made on Oct. 8. On Tuesday, the stock put in a higher low at just above the $1.35 level, which may indicate the stock is headed into a tightening range.
The stock could also be settling into a bear flag pattern with the pole created between Oct. 8 and Oct. 12 and the flag formed between Tuesday and Wednesday. If the pattern is recognized, the measured move is about 44% (the length of the pole), which could see Camber Energy drop back down to the 95-cent level.
Camber Energy is trading below the eight-day and 21-day exponential moving averages (EMAs) and on Monday the eight-day EMA crossed below the 21-day, both of which are bearish indicators. But, the stock is trading above the 200-day simple moving average, which indicates overall sentiment remains bullish.
- Bulls want to see sideways consolidation on low volume for confirmation most of the sellers have exited their positions and then for big bullish volume to come in and drive the stock up over $2.45 level, which would make a higher high and indicate a trend change was in the works. There is resistance above at $1.84 and $2.29.
- Bears want to see big bearish volume come in and break Camber Energy down from the bear flag to confirm the pattern. The stock has support below at $1.36 and the 86-cent zone.

Photo by Zbynek Burival on Unsplash
Edge Rankings
Price Trend
© 2025 Benzinga.com. Benzinga does not provide investment advice. All rights reserved.
Trade confidently with insights and alerts from analyst ratings, free reports and breaking news that affects the stocks you care about.