The following post was written and/or published as a collaboration between Benzinga’s in-house sponsored content team and a financial partner of Benzinga.
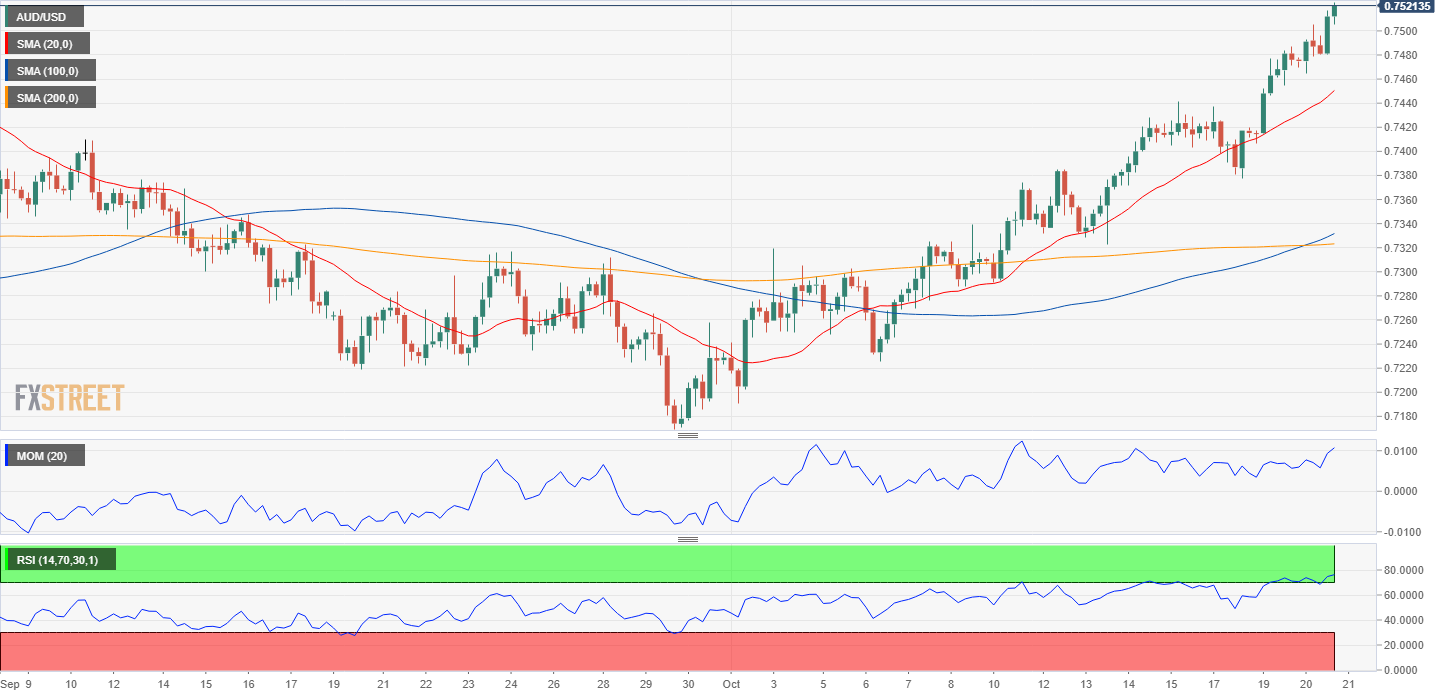
AUD/USD Current Price: 0.7523
- Rallying equities and firmer gold prices sent AUD/USD to fresh three-month highs.
- Australia will publish on Thursday Q3 NAB’s Business Confidence.
- AUD/USD is bullish, although extreme technical readings suggest a corrective decline.
The AUD/USD pair trades at its highest since early July, extending its recent rally on the back of equities’ run. US indexes rose its latest rally, with the Dow Jones Industrial Average reaching all-time highs and the S&P 500 flirting with records, underpinning the pair. Wall Street welcomed better-than-anticipated Q3 earnings reports, sending investors away from the safe-haven greenback. Firmer gold prices, as the bright metal reached fresh weekly highs, provided additional support to the aussie.
Meanwhile, Australian macroeconomic figures keep reflecting the lockdowns effects on the economy. The September Westpac Leading Index printed at -0.02%, slightly better than the previous -0-27%. The country will publish on Thursday Q3 NAB’s Business Confidence, foreseen at 5, down from 17 in the previous quarter.
AUD/USD short-term technical outlook
The AUD/USD pair trades in the 0.7520 price zone, overbought in the daily chart. The pair has extended its dally above its 20 and 100 SMAs, while technical indicators reached extreme levels, partially losing their bullish strength.
The 4-hour chart shows that AUD/USD is well above a firmly bullish 20 SMA, while the 100 SMA is crossing above the 00 SMA, both below the shorter one. The Momentum indicator maintains its bullish slope, while the RSI indicator consolidates, both within overbought levels. A corrective slide is not out of the picture, but as long as the pair holds above 0.7470, bulls will retain control.
Support levels: 0.7440 0.7400 0.7365
Resistance levels: 0.7510 0.7550 0.7590
Image Sourced from Pixabay
The preceding post was written and/or published as a collaboration between Benzinga’s in-house sponsored content team and a financial partner of Benzinga. Although the piece is not and should not be construed as editorial content, the sponsored content team works to ensure that any and all information contained within is true and accurate to the best of their knowledge and research. This content is for informational purposes only and not intended to be investing advice.
© 2025 Benzinga.com. Benzinga does not provide investment advice. All rights reserved.
Trade confidently with insights and alerts from analyst ratings, free reports and breaking news that affects the stocks you care about.
