


Nio, Inc NIO was trading up about 1% on Thursday, while continuing to consolidate a 17% move off the bottom of $33.17 the stock printed on Oct. 7.
The EV manufacturer, which recently began shipping vehicles to Norway had a rough third quarter, losing 36% of its value between July 1 and Sept. 30. On Thursday, it was reported 110-year-old asset management firm Baillie Gifford lowered its exposure in the China-based company during the period by about 287,255 shares, reducing its original 90.6 million share position by 0.3%.
The stock looks set to make a comeback during the fourth quarter, however, and has printed a number of bullish patterns to start October.
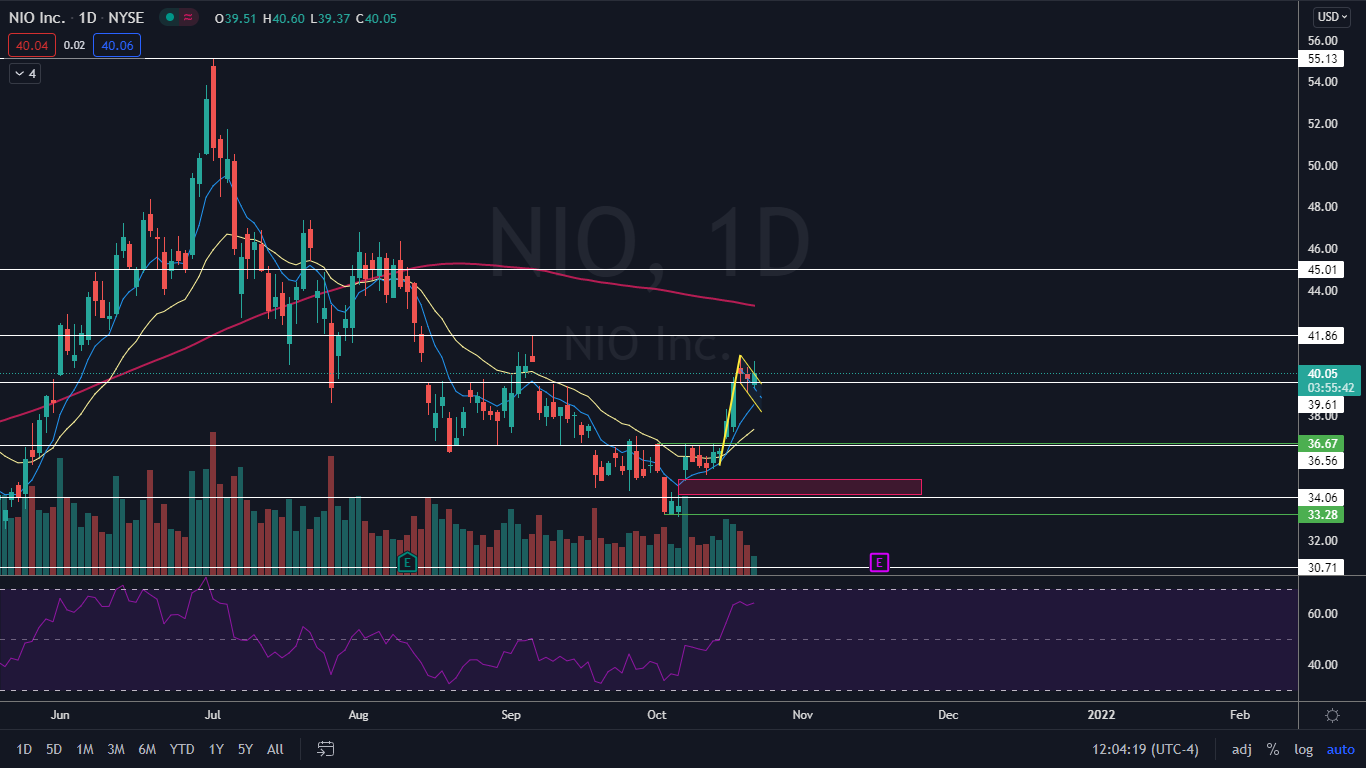
The Nio Chart: After hitting the low of $33.17, Nio reversed into an uptrend on the daily chart, putting in a consistent series of higher highs and higher lows. The stock's last higher low currently sits at the $35.60 mark, while the most previous higher high is at $40.89.
Nio is also trading in a bull flag pattern on the daily chart, with the pole created between Oct. 14 and Oct. 19 and the flag formed between Tuesday and Thursday. The measured move of a break from the bull flag, calculated by measuring the length of the pole in terms of a percentage, is just under 15%, which indicates that if the pattern is recognized, Nio could eventually soar toward $45.
There is a gap below on Nio’s chart between $34.16 and $34.93. Gaps on charts fill about 90% of the time, so it's likely Nio will trade down into the range in the future. The stock just recently filled a gap left behind Sept. 8 between $39.95 and $40.50.
Nio may need further consolidation to help cool its relative strength index (RSI), which is measuring in at about 65%. When a stock’s RSI nears or exceeds 70%, it becomes overbought, which is a sell signal for technical traders.
The stock is trading above the eight-day and 21-day exponential moving averages (EMAs), with the eight-day EMA trending above the 21-day, both of which are bullish indicators. Nio is trading below the 200-day simple moving average, however, which indicates overall sentiment is currently bearish.
- Bulls want to see continued consolidation on low volume and then for big bullish volume to push Nio up to make a higher high above $41, and then for momentum to drive the stock up over a resistance level at $41.86. If the stock can regain the level as support, it has room to trade back up toward the $45 level.
- Bears want to see increasing bearish volume drop Nio down below the eight-day EMA, which would negate the bull flag. Below the level, the stock has support at $36.61 and $34.06.
Edge Rankings
Price Trend
© 2025 Benzinga.com. Benzinga does not provide investment advice. All rights reserved.
Trade confidently with insights and alerts from analyst ratings, free reports and breaking news that affects the stocks you care about.

