

EUR/USD Current price: 1.1612
- German October IFO Survey showed an unexpected contraction in the Business Climate.
- US Treasury yields edged marginally lower at the end of the day.
- EUR/USD is at risk of falling further and retesting the year low at 1.1523.
The EUR/USD pair fell to an intraday low of 1.1590, its lowest in a week, now trading in the 1.1610 price zone ahead of the Asian opening. The shared was among the dollar’s weakest rivals, affected by worrisome German headlines. The October IFO Survey showed that the Business Climate contracted by more than anticipated to 97.7. The assessment of the current situation improved to 100.1, although expectations were sharply down, to 95.4.
Also, the Bundesbank monthly report said that the full-year growth in 2021 was likely to be significantly lower than the June forecast of 3.7% due to persistent supply chain issues, while the momentum in the service sector is expected to slow “considerably.” Finally, the Bundesbank said it sees inflation rising for the time being before gradually declining in 2022.
On the other hand, the US released the September Chicago Fed National Activity Index, which declined to -0.13 from 0.05 in August. The Dallas Fed Manufacturing Business Index improved to 14.6 in October, beating expectations. In the meantime, US government bond yields ticked lower, with that on the 10-year note currently around 1.63%. The US will publish October CB Consumer Confidence on Tuesday, expected to have contracted to 108.4 from 109.3 previously.
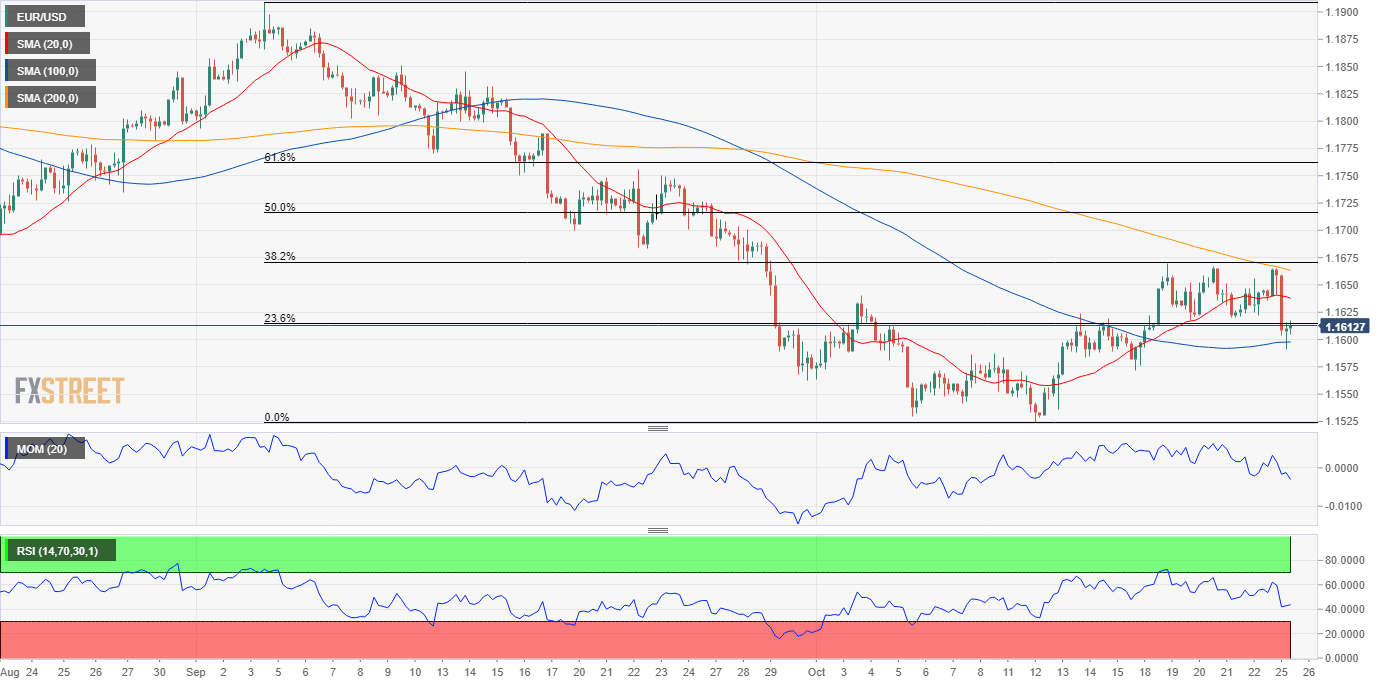
EUR/USD short-term technical outlook
The EUR/USD pair is under selling pressure and could extend its slide towards the year low at 1.1523. The pair is currently trading around the 23.6% retracement of its latest daily decline after meeting sellers around the 38.2% retracement last week. In the daily chart, the pair has managed to bounce from a bearish 20 SMA but remains far below the longer ones, which also head firmly lower. The Momentum indicator has stabilized around its midline, while the RSI offers a mildly bearish slope, currently at around 45.
The 4-hour chart shows that the pair bounced from a directionless 100 SMA, but that it remains below its 20 and 200 SMA, with little directional strength, as technical indicators bounced from near oversold readings but remain within negative levels, reflecting the ongoing bounce rather than suggesting further gains ahead.
Support levels: 1.1570 1.1525 1.1480
Resistance levels: 1.1670 1.1715 1.1750
Image Sourced from Pixabay
© 2025 Benzinga.com. Benzinga does not provide investment advice. All rights reserved.
Trade confidently with insights and alerts from analyst ratings, free reports and breaking news that affects the stocks you care about.

