


Although noise around AMC Entertainment Holdings, Inc AMC has lessened recently with little movement in share price caused by lack of volatility and low volume, the stock is still wildly popular amongst retail traders.
The apes on various social media apps such as Reddit and Twitter haven’t quieted as they continue to vocalize their campaign to highlight the need for market transparency to level the playing field between retail traders and institutions and hedge funds.
Many of the retail traders ‘hodling’ the stock are also looking forward to when AMC prints its third-quarter earnings on Nov. 9. When the movie chain reported its second-quarter results Aug. 9, the stock stumbled over the two trading days that followed before soaring about 78% higher between Aug. 11 and Sept. 13
See Also: AMC Mulls Creating Its Own Cryptocurrency, Getting 'Hyperactive' In The Space
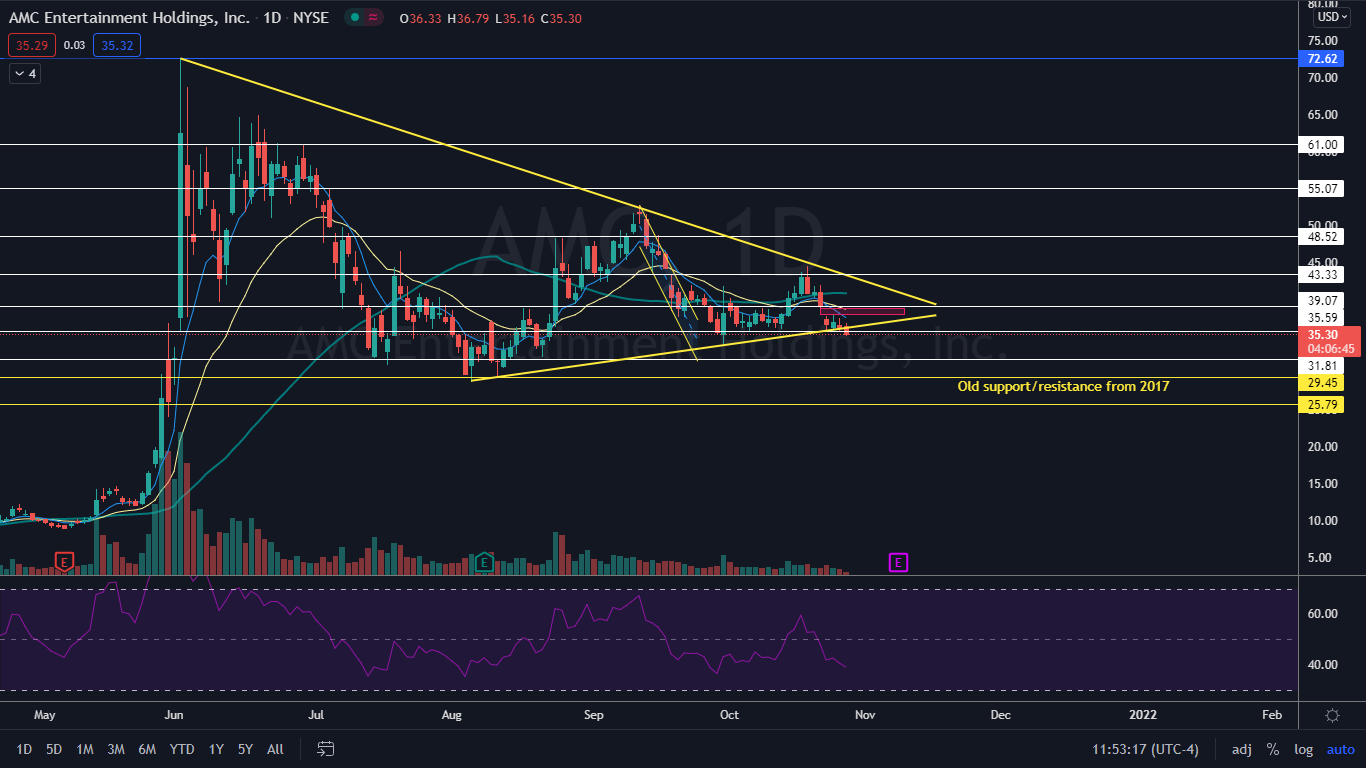
The AMC Chart: AMC has been trading under a descending trendline since Jun. 2 when the stock hit an all-time high of $72.62. AMC has also been trading up above an ascending trendline since Aug. 5. The two trendlines shape AMC into a pennant pattern on the daily chart.
On Wednesday, AMC fell through the bottom of the pennant pattern and through a support level at $35.59. The bearish break from the pattern didn’t receive immediate follow through, however, which could indicate a bear trap is being set up if bulls come in and buy the dip to pop the stock back up into the pattern.
AMC has a gap left behind on the chart from Oct. 22 that falls between the $37.85 and $38.80 range. Gaps on charts fill about 90% of the time, which makes it likely the stock will trade back up toward the $39 level in the future.
AMC’s relative strength index (RSI) was measuring in at about 39% on the daily chart, but was nearing the 30% level on the hourly timeframe, which indicates that both a short-term and longer-term bounce may be in the cards. When a stock’s RSI reaches or exceeds the 30% level, it can be a buy signal for technical traders.
The stock is trading below the eight-day and 21-day exponential moving averages (EMAs), with the eight-day EMA trending below the 21-day, both of which are bearish indicators. AMC is also trading below the 50-day simple moving average, which indicates longer-term sentiment is bearish.
- Bulls want to see the dip below the pennant bought and for the stock to pop back up over the higher resistance level and back into the pattern. If AMC can hold the lower trendline as support, it has room to fill the gap and attempt to regain support at $39.07, which would allow it to recapture the EMAs.
- Bears want to see big bearish volume come in and confirm AMC has made a bear break from the pennant. The stock has support below at $31.91 and $29.45.
Edge Rankings
Price Trend
© 2025 Benzinga.com. Benzinga does not provide investment advice. All rights reserved.
Trade confidently with insights and alerts from analyst ratings, free reports and breaking news that affects the stocks you care about.

