


GameStop Corporation GME, Nike, Inc NKE and Palantir Technologies, Inc (NYSE: PLTR) are all trading higher in strong uptrends. An uptrend occurs when a stock consistently makes a series of higher highs and higher lows on the chart.
The higher highs indicate the bulls are in control, while the intermittent higher lows indicate consolidation periods. Traders can use moving averages to help identify an uptrend with rising lower frame moving averages (such as the eight-day or 21-day exponential moving averages) indicating the stock is in a steep shorter-term uptrend and rising longer-term moving averages (such as the 200-day simple moving average) indicating a long-term uptrend.
A stock often signals when the higher high is in by printing a reversal candlestick such as a doji, bearish engulfing or hanging man candlestick. Likewise, the higher low could be signaled when a doji, morning star or hammer candlestick is printed. Moreover, the higher highs and higher lows often take place at resistance and support levels.
In an uptrend the "trend is your friend" until it’s not, and in an uptrend there are ways for both bullish and bearish traders to participate in the stock:
- Bullish traders who are already holding a position in a stock can feel confident the uptrend will continue unless the stock makes a lower low. Traders looking to take a position in a stock trading in an uptrend usually find the safest entry on the higher low.
- Bearish traders can enter the trade on the higher high and exit on the pullback. These traders can also enter when the uptrend breaks and the stock makes a lower low indicating a reversal into a downtrend may be in the cards.
- See Also: How to Read Candlestick Charts for Beginners
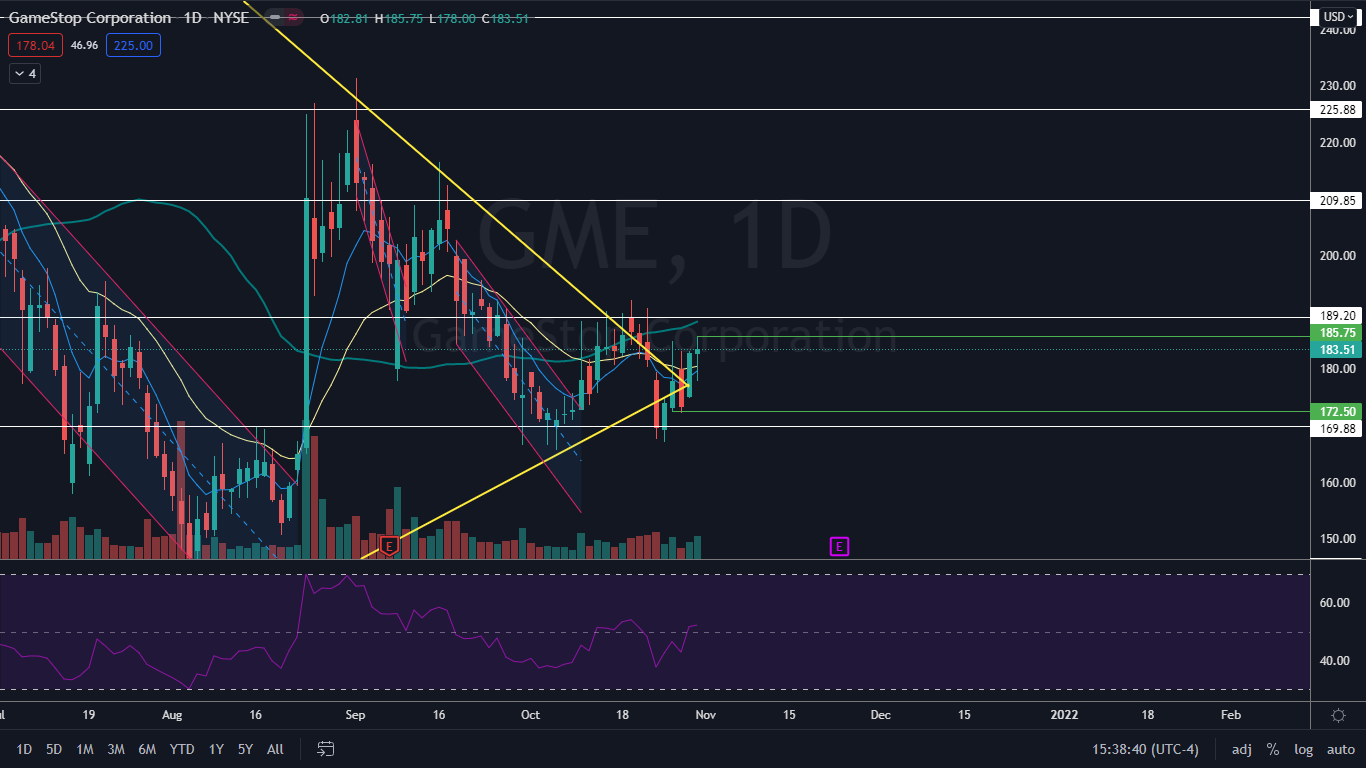
The GameStop Chart: GameStop reversed course into an uptrend on Oct. 25 and made an Oct. 26 higher low at the $172.50 level. The stock is also creating a bullish double bottom pattern when paired with the price action of Oct. 27. GameStop’s previous higher high was created on Friday at $185.75. Bullish traders will want to see continuation on the move in the form of GameStop rising above the level over the coming days.
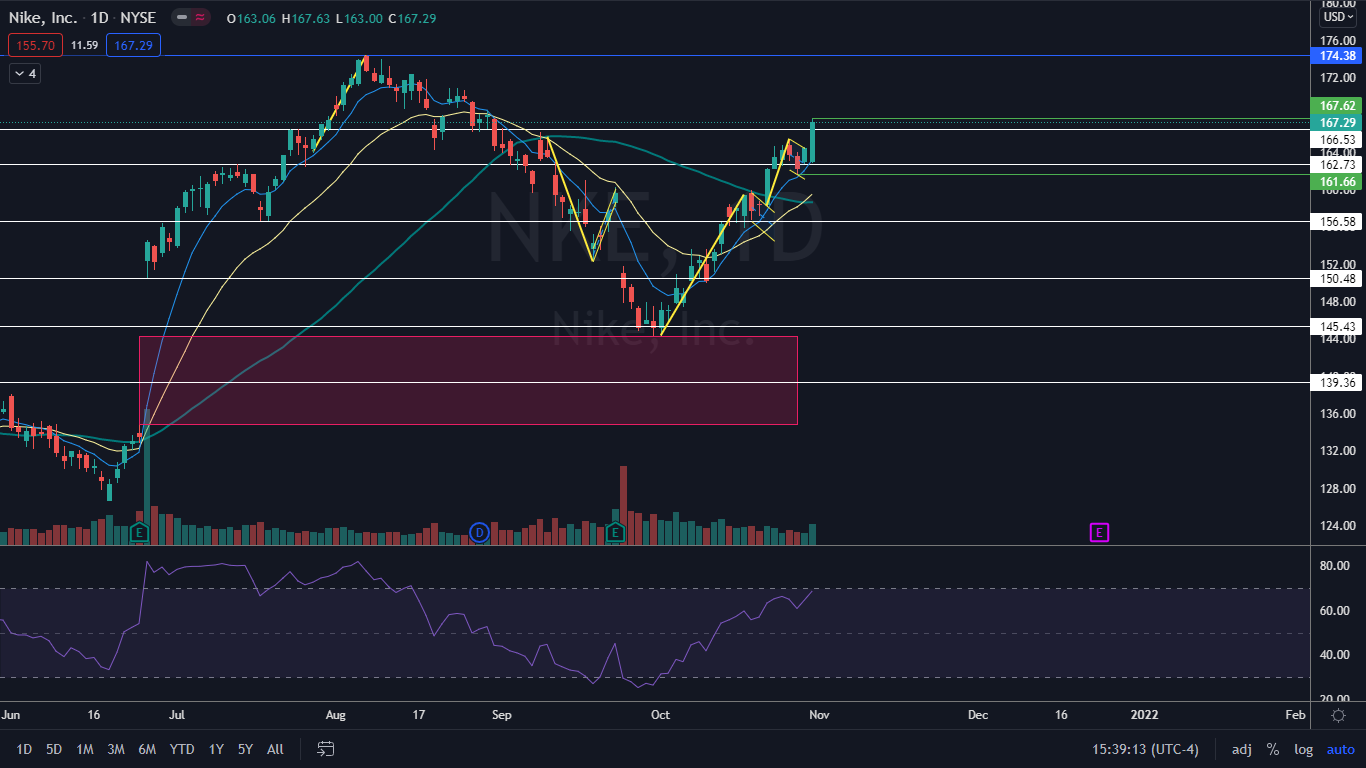
The Nike Chart: Nike has been trading in a consistent uptrend since creating a double bottom patter on Sept. 30 and Oct. 1 at $144.36. The stock’s most recent higher low took place on Oct. 27 while the most recent higher high was creating on Friday when Nike broke up bullishly from a bull flag pattern on the daily chart. Bullish traders can watch for Nike’s uptrend to continue as the stock rides up the eight-day exponential moving average (EMA) on the daily chart.
The Palantir Chart: On Oct. 27, Palantir put in a higher low at $25.02 after creating a higher high at $26.75 on Oct. 26. The stock has been trading in a strong uptrend since Oct. 8 when it bounced off the lower trendline of a rising channel pattern. Bulls can watch for Palantir to make another higher high over the coming days as, like Nike, the stock rides up the eight-day EMA.

© 2025 Benzinga.com. Benzinga does not provide investment advice. All rights reserved.
Trade confidently with insights and alerts from analyst ratings, free reports and breaking news that affects the stocks you care about.

