On Tuesday, Nike, Inc NKE was trading up about 1% following a report the company had filed seven trademark patents in preparation for entering into the metaverse. The trademarks will protect its logos, such as “Just Do It,” “Air Jordan” and “Jumpman” among others, once it begins selling virtual branded apparel.
Nike’s virtual clothing and footwear won’t be affected by the supply chain issues that bogged down its 2022 fiscal outlook and caused the stock to drop 6.26% the following day. Nike’s stock fell a further 3.52% over the course of Sept. 27 to Sept. 30 before reversing course and as of Tuesday, the stock had not only erased all of its losses, and more, but was heading toward all-time highs.
See Also: Why NFT Sneakers Could Be Coming Soon From Nike
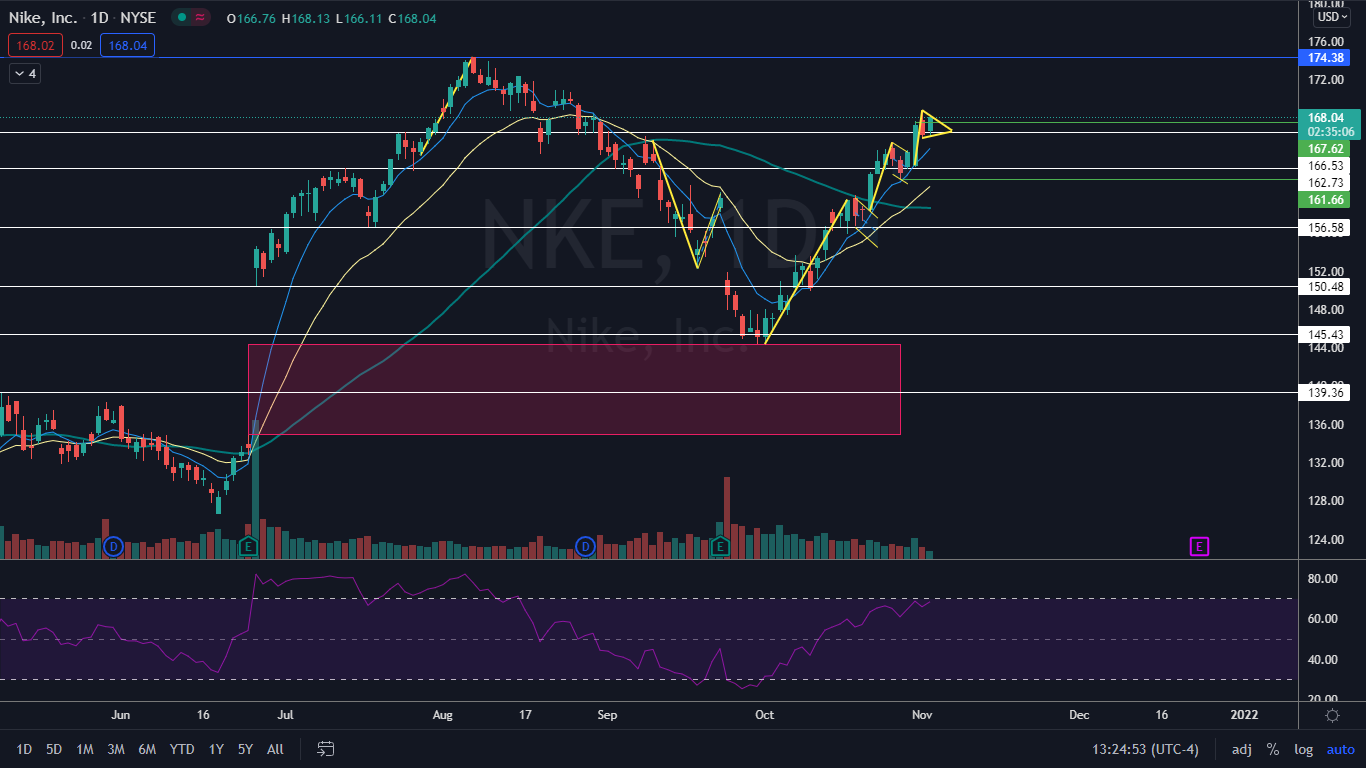
The Nike Chart: On Sept. 30 and Oct. 1, Nike created a bullish double bottom pattern at the $144.36 level and reversed course into a strong uptrend. Within the uptrend, Nike has made a consistent series of higher highs and higher lows throughout its 16% rise.
Nike has also created a series of bull flag patterns on the daily chart that have consistently been recognized by the market. On Tuesday Nike looked to be nearing the completion of a third flag, with the pole created between Oct. 29 and Monday and the flag beginning on Monday into Tuesday. The measured move of a break out from the flag, if it's once again recognized, is about 4.5%, which means Nike could trade right back to its Aug. 6 all-time high of $174.38.
Nike’s relative strength index (RSI) was measuring in at about 68% on Tuesday, which may give bullish traders cause of mild concern. When a stock’s RSI reaches or nears the 70% mark it becomes overbought, which can be a sell signal for technical traders.
Nike also has a large gap below left behind on June 25 between $134.82 and $144.36. Gaps on charts fill about 90% of the time, which means Nike is likely to trade down into the range in the future although it could be a considerable amount of time before that happens.
Want direct analysis? Find me in the BZ Pro lounge! Click here for a free trial.
Nike is trading above the eight-day and 21-day exponential moving averages (EMAs), with the eight-day EMA trending above the 21-day, both of which are bullish indicators. The stock is also trading above the 50-day simple moving average, which indicates longer-term sentiment is bullish.
- Bulls shouldn’t mind seeing further consolidation and then for big bullish volume to drive Nike up through the top of the flag pattern and toward the stock’s all-time high. If the stock can break through into blue skies on high volume, there is no resistance above in the form of price history.
- Bears want to see big bearish volume come in and drop Nike down through the bottom of the flag pattern to negate the bullish pattern. The stock has support below at $166.53 and $162.73.

Edge Rankings
Price Trend
© 2025 Benzinga.com. Benzinga does not provide investment advice. All rights reserved.
Trade confidently with insights and alerts from analyst ratings, free reports and breaking news that affects the stocks you care about.