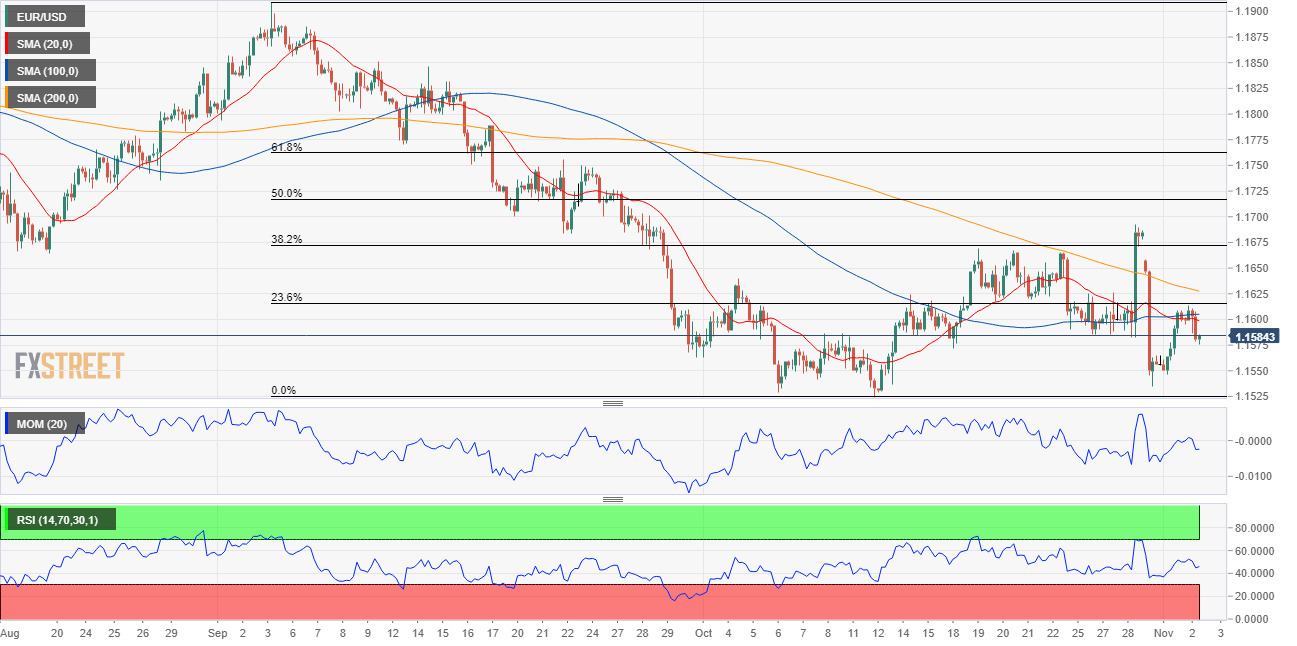
EUR/USD Current price: 1.1584
- The US Federal Reserve is expected to reduce financial support by at least $15 billion per month.
- European manufacturing output was downwardly revised in October, bottlenecks are still an issue.
- EUR/USD has slid below the 1.1600 level, could extend its slide to fresh yearly lows.
The EUR/USD pair fell to 1.1574, trading nearby ahead of the Asian opening. The American dollar benefited from cooling rate hike expectations amid policymakers stubbornly repeating the “temporary high” inflation mantra. Government bond yields eased with that on the 10-year Treasury note falling to 1.528%, now hovering around 1.54%.
Meanwhile, Asian and European equities struggled to post gains, while US indexes advanced, with the DJIA and the S&P500 reaching all-time highs. On the other hand, mixed EU data undermined demand for the shared currency. Markit released the final readings of the October Manufacturing PMIs. The German index was downwardly revised to 57.8 from 58.2, while that for the Union was confirmed at 58.3, below the preliminary estimate of 58.5. According to the official report, “supply bottlenecks remained a major hindrance to Germany's manufacturers at the start of the fourth quarter.”
The US released November IBD/TIPP Economic Optimism, which decreased to 43.9 from 46.8 previously. The US Federal Reserve will announce its decision on monetary policy on Wednesday. The central bank is expected to officially announce how it will cut financial support. Market participants anticipate US policymakers will decide to reduce the monthly purchases of Treasuries and mortgage-backed securities by $15 billion per month, to finalize it mid-2022. If the Fed announces a larger monthly reduction of facilities, the dollar may reach fresh 2021 highs vs the common currency.
EUR/USD short-term technical outlook
While still range-bound, chances for a bearish leg in EUR/USD have increased. The daily chart shows that the pair keeps meeting sellers around the 23.6% retracement of its latest daily decline at 1.1615, while its currently sliding below its 20 SMA. The near-term moving average is directionless, but the longer one keeps heading south far above the current level. Meanwhile, technical indicators head lower with limited strength, currently piercing their midlines.
The pair is neutral-to-bearish according to the 4-hour chart, as it has finally fallen below its 20 and 100 SMAs, which converge below the mentioned Fibonacci resistance level. At the same time, technical indicators remain within negative levels, the Momentum advancing but the RSI steady at around 46. Bears will likely take over the pair on a break below 2021 at 1.1523.
Support levels: 1.1520 1.1470 1.1430
Resistance levels: 1.1615 1.1670 1.1710
Image by 👀 Mabel Amber, who will one day from Pixabay© 2025 Benzinga.com. Benzinga does not provide investment advice. All rights reserved.
Trade confidently with insights and alerts from analyst ratings, free reports and breaking news that affects the stocks you care about.
