

AUD/USD Current Price: 0.7430
- The RBA dropped the yield curve-control, but repeated rates will remain low for long.
- The US Federal Reserve will kick-start tapering its massive pandemic financial support program.
- AUD/USD at risk of losing the 0.7400 price zone and approaching 0.7330.
The AUD/USD pair plummeted after the Reserve Bank of Australia monetary policy announcement, extending its decline later in the day to 0.7419, its lowest in two weeks. The RBA maintained the cash rate unchanged as widely anticipated at 0.1%, and dropped the yield-curve control, officializing their actions from last week. Policymakers also decided to continue to purchase government securities at a rate of A$ 4 billion per week until at least February 2022.
The decision to unwind facilities came after higher-than-expected Q3 inflation figures spurred speculation of a soon to come rate hike in the country, leading to a sharp advance in near-term government bond yields. However, Governor Philip Lowe said that he thinks that markets have overreacted to inflation data, adding that it is extremely unlikely for inflation to jump beyond RBA projections. Furthermore, he said that using rate hikes to combat higher house prices is not on policymakers’ radar.
On employment, Lowe noted that there is still considerable uncertainty on wages growth and that the unemployment rate needs to fall below the lower end of 4% to have a chance of seeing higher rates. The greenback benefited from tempered rate hike expectations, advancing alongside Wall Street.
Australia is having a busy macroeconomic session on Wednesday, as it will publish the October AIG Performance of Construction Index, the October Commonwealth Bank Services PMI, Building Permits for the same month and October TD Securities inflation.
AUD/USD short-term technical outlook
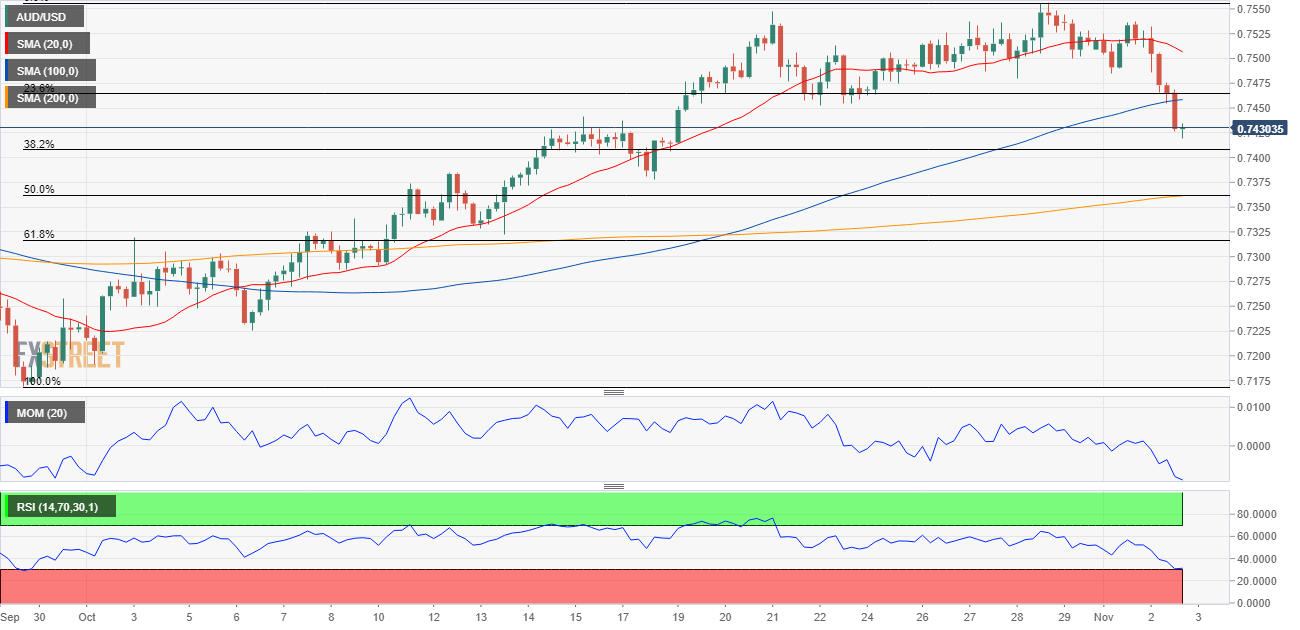
The AUD/USD pair had shed roughly 100 pips, and trades near the 38.2% retracement of the September/October rally at 0.7407, the immediate support level. The daily chart shows that it is currently challenging a bullish 20 SMA, which remains above a mildly bearish 100 SMA. Meanwhile, technical indicators head firmly south, approaching their midlines-
The pair is oversold in the near term, as the 4-hour chart shows technical indicators consolidating in extreme readings, as the price broke below its 100 SMA for the first time in almost a month.
Support levels: 0.7405 0.7370 0.7330
Resistance levels: 0.7460 0.7500 0.7550
Image by Patty Jansen from Pixabay© 2025 Benzinga.com. Benzinga does not provide investment advice. All rights reserved.
Trade confidently with insights and alerts from analyst ratings, free reports and breaking news that affects the stocks you care about.

