
AT-A-GLANCE
- Japan’s Nikkei 225 trading one-third below 1989 peak of 39,000
- In the same period, Dow has surged from 2,226 to over 36,000
- Japanese stocks price-to-book, price-to-sales ratios lower than U.S. indices
- Big variations in IT subsector composition weightings in Nikkei, S&P 500
- Japan has more consumer discretionary, industrial stocks than U.S.
Source: CME Group
For much of 2021 Japan’s Nikkei 225 Index has been trading at around 30,000 points. While many European and U.S. indices have hit record highs this year, Japan’s stock market remains about one third below its peak at the end of 1989 when the Nikkei topped 39,000. Indeed, the divergence between Japanese and U.S. equities over the past 32 years has been remarkable (Figure 1).
Figure 1: U.S. and Japanese equities have diverged since the end of the 1980
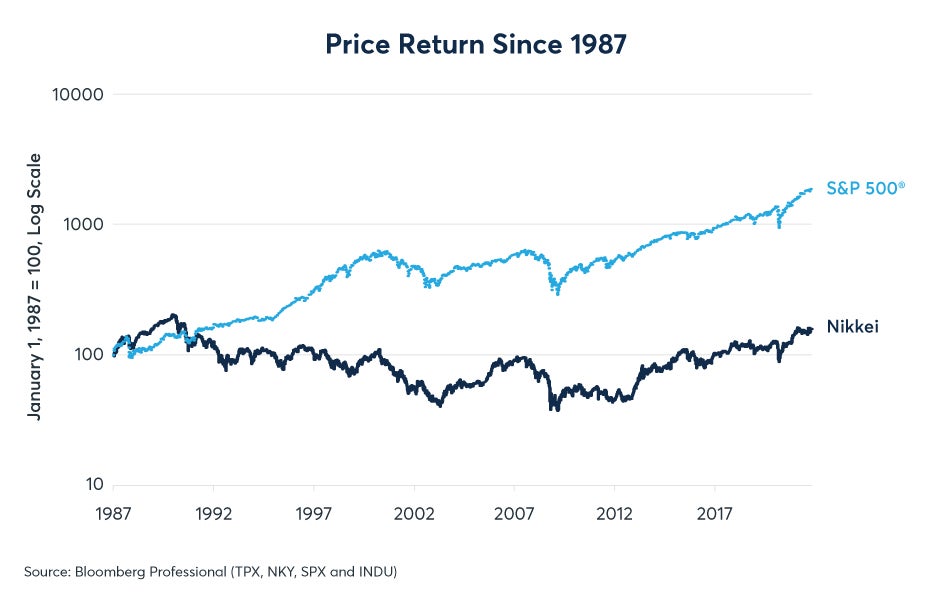
At the 1989 peak, Japanese equities traded at around 71x earnings. The inverse of the price-to-earnings ratio (the earnings yield) was 1.4%, a striking low number, especially given that Japanese long-term interest rates at the time were 8% to 9%. U.S. equities traded at about one-fifth of those valuation levels at the time.
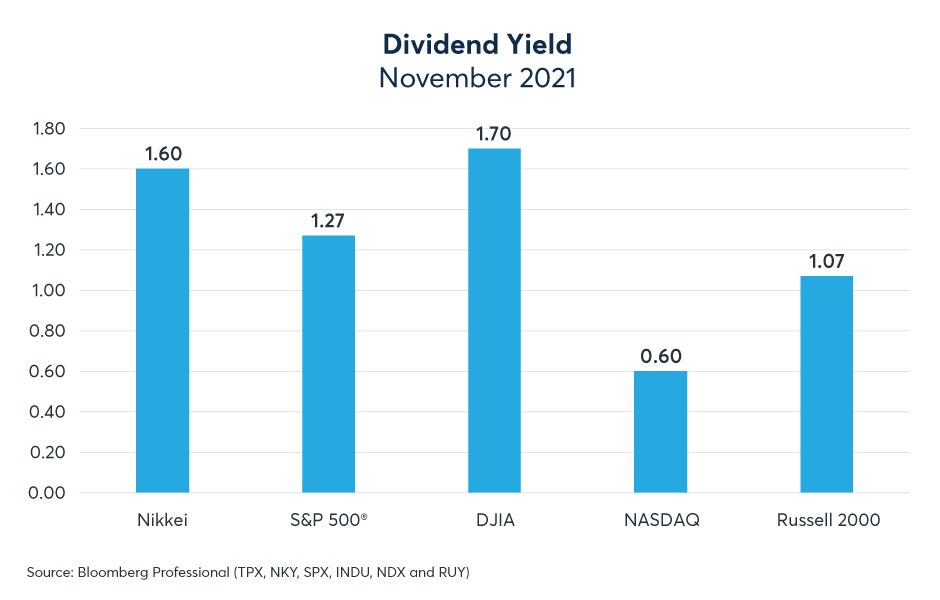
Fast forward to 2021 and the situation has reversed in some way. By almost any measure, Japanese stocks are less expensive today than their American counterparts. Japanese stocks trade at much lower price-to-sales and price-to-book ratios than the U.S. indices (Figures 2 and 3). They also sport higher earnings yields and, for the most part, higher dividend yields than the U.S. markets as well (Figures 4 and 5).
Figure 2: The Nikkei 225 trades at a fraction of U.S. price-to-sales ratios

Figure 3: Nikkei 225 stocks trade at a fraction of U.S. price-to-book ratios

Figure 4: The Nikkei 225 has nearly 2x the earnings yield of large cap U.S. equity indices

Figure 5: The Nikkei 255 has a higher dividend yield than U.S. indices, except the Dow
Part of the difference in current valuation levels between the U.S. and Japanese markets may stem, in part, from differences in sector composition. Both the Nikkei 255 and the S&P 500 have substantial weights to technology stocks (21% and 28%, respectively), but the subsector breakdown is very different. Japan’s IT sector produces mainly hardware, semiconductors and some software. These tend to be more highly competitive and slower growing businesses than the U.S. tech sector. Japan also has a much higher concentration of consumer discretionary and industrial stocks than the U.S., while the U.S. market includes somewhat larger health care, and a much larger financial services sector.
Japanese equities may also have been hampered somewhat by the slow growth in Japan’s domestic demand and persistently mild deflation. Japan’s nominal GDP has barely changed since 1994 whereas U.S. nominal GPD has grown by about 4-5% per year on average. Four percent growth compounded out over a quarter century comes to a 166% increase.
The preceding post was written and/or published as a collaboration between Benzinga’s in-house sponsored content team and a financial partner of Benzinga. Although the piece is not and should not be construed as editorial content, the sponsored content team works to ensure that any and all information contained within is true and accurate to the best of their knowledge and research. The content was purely for informational purposes only and not intended to be investing advice.
© 2025 Benzinga.com. Benzinga does not provide investment advice. All rights reserved.
Trade confidently with insights and alerts from analyst ratings, free reports and breaking news that affects the stocks you care about.

