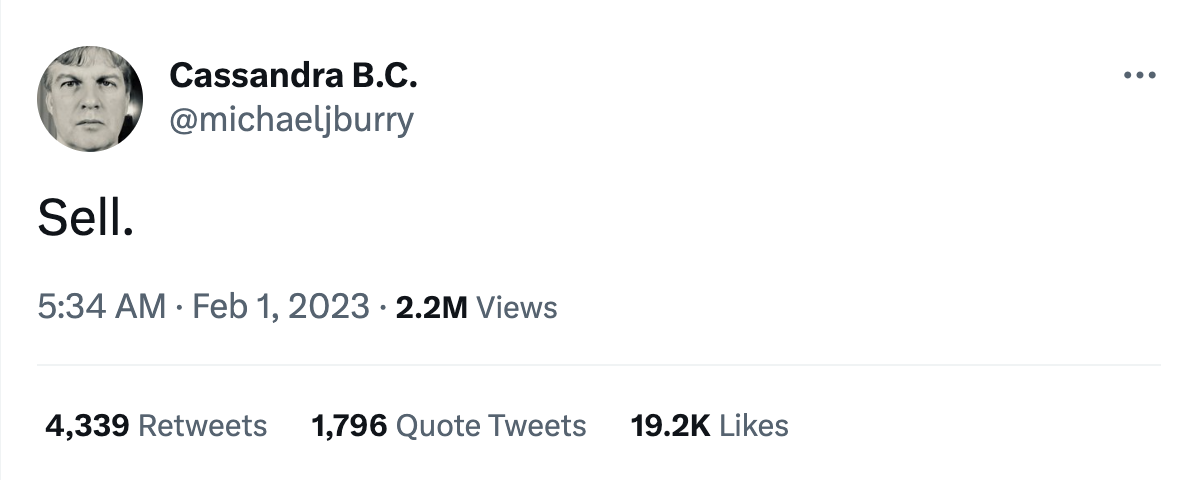
‘The Big Short’ investor Michael Burry has again caused a social media furor with a one-word tweet: ‘Sell.’
The tweet, which at the time of writing has already garnered 2.1 million views, comes a few hours ahead of the Federal Reserve’s monetary policy announcement.
Screenshot from Burry's Twitter
Burry, who rose to prominence betting against the housing market in the run-up to the financial crisis, has been bearish on the market which he indicated last week using a chart appearing to be that of the S&P 500 index during 2002.
Also Read: Investing In Exchange Traded Funds: A Beginner's Guide
Chart: Burry’s chart highlighted the region between mid-Sept. 2001 and mid-March 2002 when the S&P 500 rose 18% following the stock market crash in the wake of the 9/11 attacks. This was the period, as Burry highlighted in his chart, where the 50-DMA (daily moving average) crossed over the 100-DMA indicating a bullish trend.
However, between March 2002 and Sept. 2002, the market shed a whopping 30%, clearly highlighting the fallacies of false breakouts that many investors follow and often fall into traps.
Price Action: The S&P 500 has gained over 6% in 2023 so far. The SPDR S&P 500 ETF Trust SPY has gained 6.74% while the Invesco QQQ Trust Series 1 QQQ gained 11.4% during the period. Only time would tell whether the Fed decides to slow down its rate hike pace, whether the markets cheer the central bank’s language and whether a soft landing would really be the case. Till then, as experts say, it’s all speculation!
Michael Burry illustration by Gonzalo Lanzilotta for Benzinga.
Edge Rankings
Price Trend
© 2025 Benzinga.com. Benzinga does not provide investment advice. All rights reserved.
Trade confidently with insights and alerts from analyst ratings, free reports and breaking news that affects the stocks you care about.
