
For those who didn’t get enough drama Monday and Tuesday as the Dow Jones Industrial Average ($DJI) cratered nearly 2,000 points, things might be more interesting today.
That’s because major indices are on the cusp of testing some key levels that many investors think of as psychological “safety nets,” though no particular price level is guaranteed to stop the bleeding. For the S&P 500 Index (SPX), the area to consider watching today and the rest of the week is right around 3050, which sits just above the 200-day moving average.
The 200-day moving average held very firmly several times last year when the trade war caused stocks to test it. Any kind of serious or prolonged drop below that level would really change the tenor of things after the year began with an incredible rally.
Overnight Rally Attempt
Stocks initially gained in overnight trading but couldn’t hold on. Then they bounced back as the opening bell approached. Things were all over the place, which might actually be a good sign. Maybe there’ll be one more day of craziness and more volatility today as people look for areas where they feel they can buy stocks with more certainty.
On the downside, crude is taking it on the chin again, trading below $50 a barrel. The SPX is down nearly 8% from last week’s all-time high and the Nasdaq (COMP) is down nearly 9% from its peak.
The back-to-back 3% declines for the SPX this week was the first time that happened since November 2008 during the financial crisis. Apple Inc AAPL and Facebook Inc FB are down 10% into correction territory, and the two-day rout has stripped $1.7 trillion in value from the SPX. It happened so fast it brings to mind the old adage that stocks climb the stairs and fall out the window.
Some think buying interest might show up today, noting that many times in the past there’ve been two days of fierce selling before people came back for a nibble. That’s far from guaranteed, however, and any early buying might get met by more sellers as sales volume at the end of yesterday’s session indicated there might be more room to the downside.
People who tried to nibble on stocks early yesterday soon got punished as the Centers for Disease Control and Prevention (CDC) spooked the market and pretty much the entire country by saying disruption to everyday life from coronavirus “may be severe.” Later yesterday, the CDC said the virus is likely to become a pandemic, stirring up all kinds of fear.
Cyclical sectors like Energy, Financials, and Information Technology took the biggest blows yesterday, with Financials getting cooked by record low 10-year Treasury yields, which at one point dipped below 1.32%. Crude slid below $50 a barrel for the first time in about a week, and volatility galloped higher.
It looks like many investors are buying assets like bonds, gold and products that track the Cboe Volatility Index (VIX)—Wall Street’s “fear gauge,” which tends to rise when stock prices fall. Some people are apparently selling stocks to lock in profits after an incredible run in the market that got underway more than 13 months ago.
VIX is at just below 27 to start the day. The 10-year yield bounced back to nearly 1.37%, which is a nice sign of improvement. Volatility is likely to remain elevated for a while, whatever happens with the major indices. Things don’t tend to smooth out quickly after what we just went through.
On The Contrary
Since everyone knows the fear that’s out there and there’s little anyone can do about it if they’re not a health researcher or doctor, let’s look at a few reasons why panic isn’t warranted (and selling out of panic is never the right thing to do). Here they are, in no particular order:
- Oversold Tech? The Information Technology sector has already taken a 10% haircut from recent highs, putting it officially into correction territory. While that’s not good news, it’s possible we’re getting toward the point where some investors might see the damage as being a bit overdone, and start looking for bargains.
- Eyeing the 200-day Moving Average. As noted above, the SPX is near levels it’s often bounced from over the last year. It might be wise to keep a close eye on 3044, which is the exact 200-day moving average. There was some slowdown in the selling yesterday afternoon when the SPX approached its 100-day moving average. That didn’t last and the downturn resumed, but it could be a sign that the moving averages still mean something.
- Overbought Bonds? The bond market looks a bit pricey by some metrics, but people keep piling in as they search for what they apparently hope is a safer spot on the bench. If the Fed doesn’t make any near-term moves, investors might read that as the Fed having faith in the economy’s resilience. That in turn could finally be what turns bonds back lower and adds a bit more heft to yields. We’re not there yet, however.
- First-World Virus. The spread of the virus beyond China into countries with more modern health systems and open news media could give people more of a sense of how quickly the virus spreads and just how deadly it might be. Though no one wants to see the virus spread, any signs that countries like South Korea, Italy, and other European nations can keep it contained might be a dose of good news for the markets. At this point, few analysts trust the numbers out of China.
- Consumer to the Rescue? The Conference Board said Tuesday that February U.S. consumer confidence grew slightly from January to a headline number of 130.7, up from 130.4. What’s important about this one is that it includes the period when people knew about coronavirus, though it doesn’t include the latest cratering on Wall Street.
- Earnings Hold Up. Several major companies including HP Inc HPQ, Home Depot Inc HD, and Macy’s Inc M delivered solid earnings this week, though results generally reflected a time period before the virus knocked on the economy’s door. Salesforce, Inc. CRM followed up with a strong quarterly showing last night. Lowe’s Companies Inc LOW results looked mixed, however, with revenue falling short of analysts’ estimates.
- It’s a Gas. With crude prices descending below $50 a barrel on Tuesday, it’s likely gasoline prices will also come down, giving consumers a break at the pump. The average amount paid for a gallon of gas is now under $2.50 across the country, with some stations in the South now selling gas for less than $2 a gallon. That’s down from a national average of around $2.90 just 10 months ago, according to online price tracker GasBuddy. Sometimes savings on gas end up being spent in other places, helping the consumer economy.
- U.S. Still Seems Healthy. Though the CDC is warning about a virus situation developing in the U.S., so far cases have been few and far between. This could change quickly and it’s important not to get ahead of ourselves on this one, but it’s reassuring for now.
- Finished Off the Lows. Some late buying did emerge Tuesday, keeping the $DJI from losing 1,000 points for a second consecutive session. It was down that much briefly at one point Tuesday afternoon, but finished down roughly 800 points. Calling this good news is a stretch, we have to admit.
- Telegraphing a Fed Response? If the Fed funds futures market is on the right track, the Fed might loosen the safety valve sooner than originally thought. According to the CME FedWatch tool, there’s now a 32% chance the Fed will lower rates by its next meeting three weeks from now, and a 66% chance there will be at least one rate cut between now and the end of April. A week ago, those numbers stood at 6% and 24% respectively (see chart below for more on the Fed).
- Beyond Meat Inc BYND is up 6% in pre-market trading after Starbucks Corporation SBUX said it will offer BYND’s sausage to customers in Canada.
Having said all that, the virus is likely to be temporary, but no one knows how long “temporary” lasts. It might be one quarter of pain. Or it could be more. The fear, however, is that things could snowball, especially with the CDC sending shivers through the market and social media spreading that message well beyond investors and into the general population.
Yesterday was the 11th time markets experienced back-to-back Major Distribution Days (MDDs), or days with 90% or greater down volume on the New York Stock Exchange (NYSE). Historically, lower lows were typically scored after MDDs, according to research by my fellow TD Ameritrade Network* contributor Michael McKerr.
Overall, markets generally recovered 4% to 7% on average over the next 5, 10, 22 days or at minimum stabilized after the second MDD day. So if history repeats itself, a “flush” could be needed to produce a rally solidly above yesterday’s close. Such a “flush” would probably mean testing the 200-day moving average in the SPX discussed above.
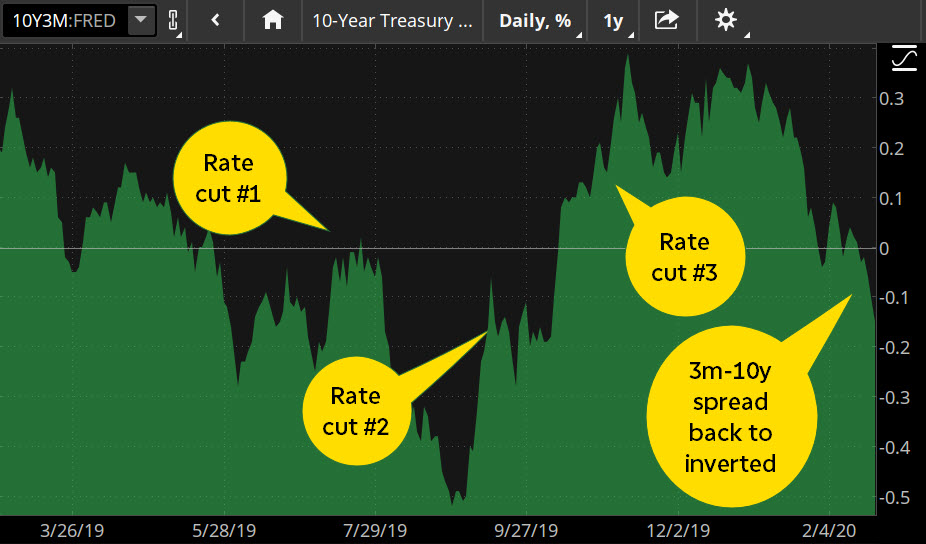
CHART OF THE DAY: 3-MONTH/10-YEAR INVERSION REVERSION. Last year, a downward trend in the 10-year Treasury yield led to a partial inversion of the yield curve—a phenomenon that often portends a recession. Three cuts to the Fed funds rate between July and October of last year helped push the front end of the yield curve below long rates. This week's flight to safety, however, pushed the 10-year back below the 3-month yield, leading some to believe the Fed might begin another round of rate cuts. Data source: Federal Reserve's FRED database. Chart source: The thinkorswim® platform from TD Ameritrade. FRED® is a registered trademark of the Federal Reserve Bank of St. Louis. The Federal Reserve Bank of St. Louis does not sponsor or endorse and is not affiliated with TD Ameritrade. For illustrative purposes only. Past performance does not guarantee future results.
Oracle Opines: Wise words from the oracle of Omaha, Warren Buffett, arguably came at a good time Monday for investors feeling a pit in their stomachs. Those butterflies are natural when the market suffers its worst two-day plunge in more than a year, but Buffett offered a good reminder of what’s made him one of the more successful investors out there. Asked on CNBC if he’d consider buying into this tough market, Buffett indicated that although he wouldn’t buy or sell based on the day’s headlines, he’d be ready to buy if he felt there were good investments to be made. “The real question is: ‘Has the 10-year or 20-year outlook for American businesses changed in the last 24 or 48 hours?’” Buffett told CNBC. He added that if the recent drop makes a good stock cheaper to buy, then it’s “your good luck.”
That’s a solid lesson to anyone tempted to lose their head when the market has a day like this. It’s also what makes Buffett a pro investor. He sees potential opportunity when others run for the hills. That doesn’t mean he randomly buys on every dip, and nor should the average investor. What it does mean is that Buffett keeps things in perspective and understands that most likely, in the great scheme of things, this week’s scary decline is one of many a typical investor will go through, and not something that should cause huge amounts of panic.
Old Bull: It’s often said that bull markets don’t die of old age, they die of fear. There’s plenty of fear around now, and no guarantees it won’t eventually put the bull to rest. However, anyone who’s a long-term investor is likely to go through several situations like this in a lifetime of watching stocks, and it’s often best to be patient, taking profit here and there when warranted but not panic selling. If you have an investment plan, it might be time to review it and make sure you’re still comfortable with your goals and that your investment allocations still make sense. Everyone’s head is spinning, so now might not be the best time to make any major decisions.
Tech Talk: For people who can’t get enough of their technical numbers, let’s talk about one more: 2873 in the SPX. That level would mark a so-called 50% retracement of the rally that took the SPX from a December 2018 low of 2350 up to last week’s all-time high of 3393. The SPX remains well above 2873, but it’s a number to think about if things really get out of hand because it could be a place where buying interest picks up.
With the $DJI and S&P 500 (SPX) breaking quickly through their 50- and 100-day moving averages the last two days, both are close to falling 10% into correction territory. It may seem like a coincidence, but where does a 10% drop from the peak take the SPX? To right near 3050. You can see why a lot of people have their eyes on that level. For the $DJI, a 10% decline would mean testing 26,700, a level that’s also symbolic because it was one the index had trouble breaking above in 2018. Once the index clawed through that, it was basically off to the races, but now that level looms in the front windshield again.
Information from TDA is not intended to be investment advice or construed as a recommendation or endorsement of any particular investment or investment strategy, and is for illustrative purposes only. Be sure to understand all risks involved with each strategy.
Image by Free-Photos from Pixabay
© 2024 Benzinga.com. Benzinga does not provide investment advice. All rights reserved.
Comments
Trade confidently with insights and alerts from analyst ratings, free reports and breaking news that affects the stocks you care about.

