Snap Inc. SNAP closed down 2.1% at $57.05.
After the close, Snap reported quarterly sales of $769.58 million, which beat the analyst consensus estimate of $743.01 million by 3.6%. The parent company of Snapchat reported breakeven earnings per share, ahead of the 5-cent per-share loss analysts estimated.
Snapchat had 280 million daily active users in the first quarter, up 22% year over year.
Below is an analysis of Snap's chart.
See Also: Where Snap Stands With Analysts

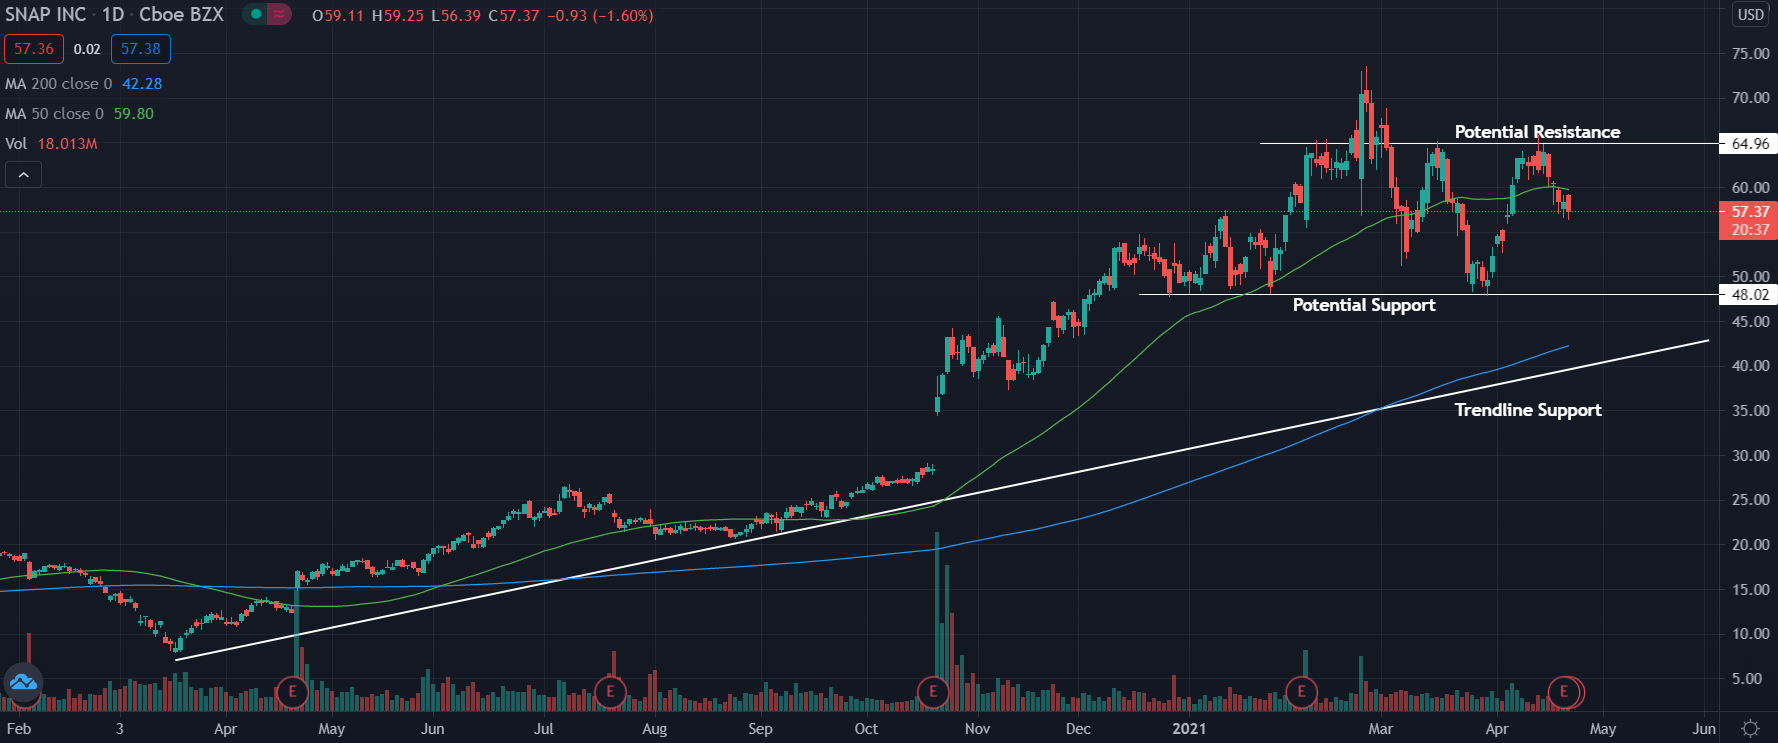
Snap Daily Chart Analysis
- Snap looks to be trading in a channel and has been uptrending throughout the past year.
- The stock is trading below the 50-day moving average (green) and above the 200-day moving average (blue), indicating the stock is most likely facing a period of consolidation.
- The 50-day moving average may hold as a resistance level and the 200-day moving average may hold as support in the future.
Key Levels To Watch
- The stock has been forming higher lows throughout the year and is trading in a channel between the price levels of $48 and $65
- The stock price will most likely not make any sudden movements while trading in the channel until a news catalyst can push the price more ferociously.
- If the price is able to cross one of the potential support or resistance lines, then it may see a stronger move in that same direction.
- If the price were to be able to cross below the possible support line drawn on the chart, it may see a stronger downward move with room to fall to the trendline that is formed by the higher lows.
What’s Next?
Bullish technical traders would like to see good earnings come out and have the stock continue to build higher lows. As long as higher lows continue to form, the stock should keep seeing gains in price in the future.
Bearish technical traders would like to see the stock break below the $48 support line and fall to the trendline support. A break below this line, which connects the lows together, could bring about a steep drop-off and a potential change in trend.
© 2025 Benzinga.com. Benzinga does not provide investment advice. All rights reserved.
Trade confidently with insights and alerts from analyst ratings, free reports and breaking news that affects the stocks you care about.