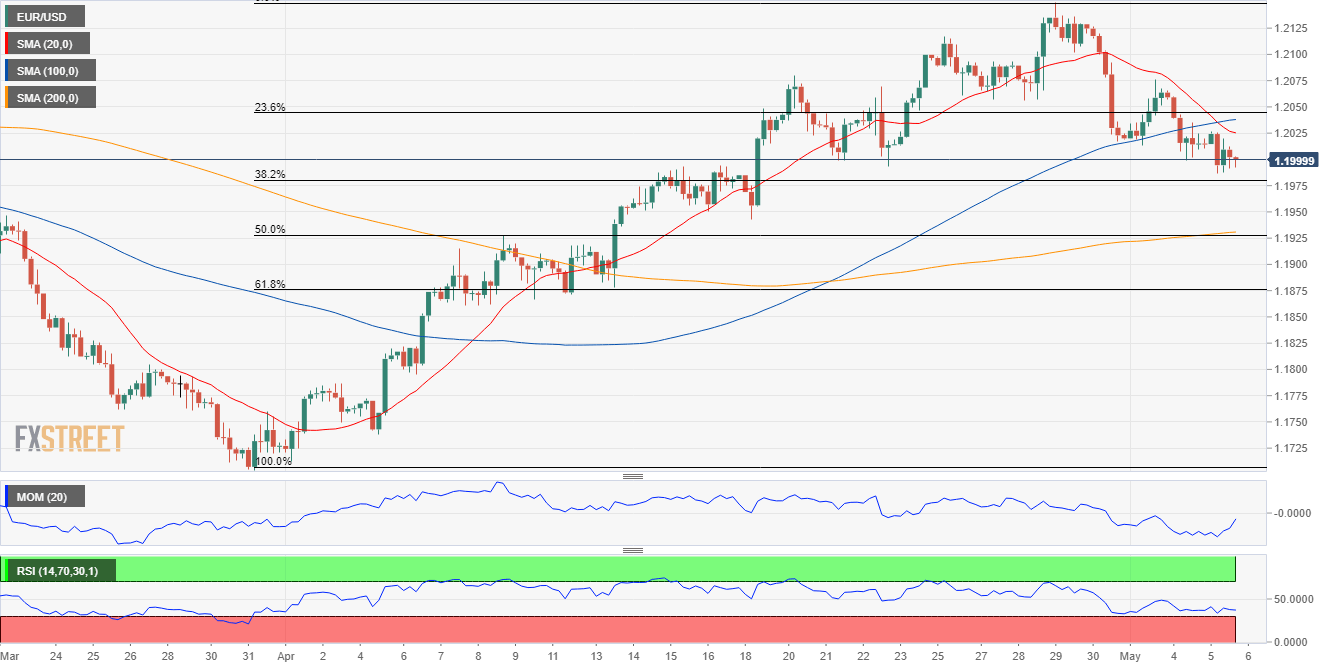
EUR/USD Current Price: 1.1999
- US Federal Reserve officials poured cold water on Treasury Secretary Yellen’s comments.
- US macroeconomic figures may have missed expectations but indicated continued growth.
- EUR/USD struggling to retain the 1.2000 level, bearish once below 1.1980.
The EUR/USD pair trades around the 1.2000 level, posting modest daily losses. The shared currency was the worst performer, as an upbeat market’s mood put some pressure on the greenback against other rivals. Stocks edged higher in Europe and America, as despite missing expectations, US data kept pointing to substantial economic progress. Meanwhile, different Federal Reserve officials poured some cold water on Treasury Secretary Janet Yellen about higher rates. Fed’s Evans said that they are not in a hurry in any way to talk about tapering, while Fed’s Rosengren noted that significant slack remains in the economy, adding that inflation and inflation expectations look stable.
The US ADP survey on private jobs creation printed at 742K in April, missing the expected 800K but improving from 565K in March. The Markit Services PMI was upwardly revised to 64.7, while the official ISM PMI printed at 62.7, missing the expected 64.3 in the same month. The April final Markit Services PMI was downwardly revised in Germany to 49.9. The index for the whole EU, however, was confirmed at 50.5 vs the preliminary estimate of 50.3.
On Thursday, Germany will publish March Factory Orders, while the EU will release March Retail Sales, seen up by 1.5% MoM. The focus during US trading hours will be put on employment-related data, as the country will publish Q1 Nonfarm Productivity and Labor Costs and Initial Jobless Claims for the week ended April 30, foreseen at 540K.
EUR/USD short-term technical outlook
The EUR/USD pair is at risk of falling further, as it is barely holding above the 38.2% retracement of its latest daily advance measured between 1.1703 and 1.2149 at 1.1980. The 4-hour chart shows that the 20 SMA has crossed below the 100 SMA, both above the current level, indicating increased selling interest. Technical indicators hold within negative levels, without clear directional strength. The pair would need to recover beyond the 1.2045 level to be able to extend gains during the upcoming sessions.
Support levels: 1.1980 1.1930 1.1875
Resistance levels: 1.2045 1.2090 1.2130
Image Sourced from Pixabay
© 2025 Benzinga.com. Benzinga does not provide investment advice. All rights reserved.
Trade confidently with insights and alerts from analyst ratings, free reports and breaking news that affects the stocks you care about.
