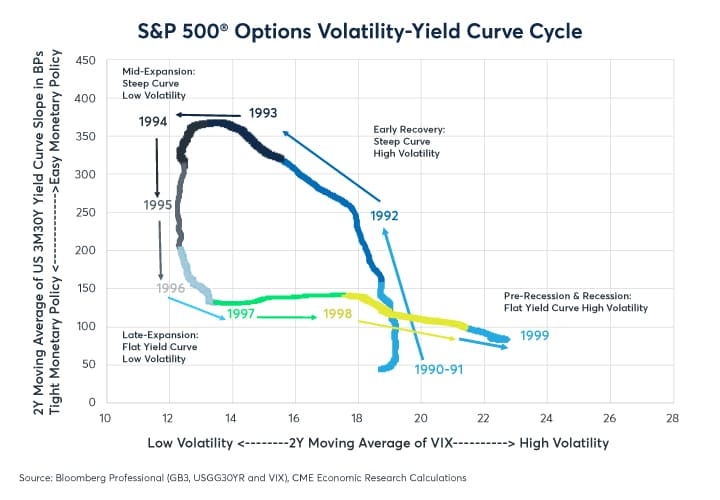
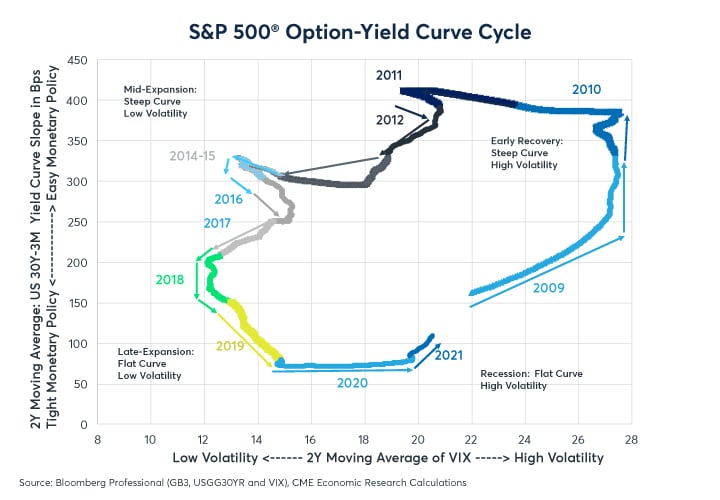
A close inspection of the history of S&P 500® options reveals how implied volatility on U.S. equity index options appears to go through periods of elevated volatility (1989-91, 1997-2003, 2008-11 and 2020-to date) interspersed with long periods of exceptionally low average levels of implied volatility (1993-97, 2003-07 and 2011-19 as seen in Figure 1.
Figure 1: S&P 500® option volatility appears to alternate between high and low volatility regimes
As we have pointed out in several previous papers on the subject, these highs and lows in volatility appear to relate to the stance of U.S. monetary policy. Over the past three decades, monetary policy has been locked in a cycle (in mathematics, a relation and not a function) with options costs, credit spreads and unemployment that works as follows:
- Early Recovery: Easy monetary policy, as evidenced by a steep yield curve, creates the conditions for an economic recovery with falling unemployment, narrowing credit spreads and easing of volatility (realized and implied).
- Mid-Expansion: Eventually falling unemployment and calm financial markets encourage the central bank to tighten policy.
- Late-Expansion: Tight monetary policy, evidenced by a flat yield curve, eventually translates into rising implied volatility on options, widening credit spreads and increasing unemployment – usually after a period of 1-2 years.
- Recession: Rising unemployment, tight credit conditions and volatile markets oblige the central bank to ease policy, steepening the yield curve.
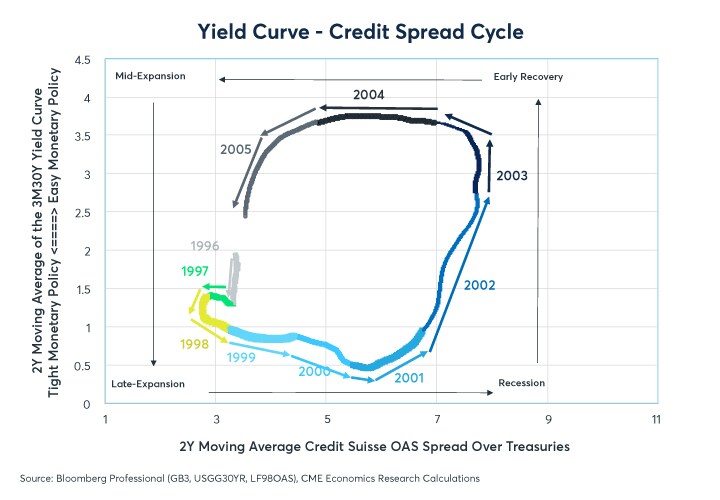
For equity index options, this cycle has repeated in full three times since 1990 (Figures 2, 3 and 4). It is not clear, however, if it will repeat a fourth time or not.
Figure 2: The first implied volatility-yield curve cycle occurred between 1990 and 2000
Figure 3: The second yield curve volatility cycle occurred between 2000 and 2008
Figure 4: The most recent cycle began in 2009
So far, the equity cycle looks like it is proceeding according to the past pattern: after a period of exceptionally flat yield curves in 2017-19, volatility rose sharply in 2020 after having spent 2018 and 2019 trending slowly higher. In response to the pandemic-induced spike in volatility/economic downturn, the Fed slashed interest rates to zero. In the face of these interest rate cuts, the U.S. yield curve remained remarkably flat throughout much of 2020 but then began to steepen in February 2021. Even so, the U.S. yield curve remains remarkably flat by historical standards (Figure 5).
Figure 5: The yield curve has steepened but remains remarkably flat by historical standards
Quantitative easing (QE) on the part of the Federal Reserve (Fed) and other central banks may explain, to a large extent, why the yield curve hasn’t steepened as much as it had at the beginning of past periods of economic expansion (1991-93, 2003-04, 2009-10). As the Fed expanded its balance sheet, purchasing longer-maturity Treasuries as well as some private sector bonds, there has been a long-term trend towards flatter and flatter yields curves (Figure 6).
Figure 6: Have QE long-term asset purchases driven long-bond yields lower?
That said, there are some questions as to whether the trend towards flatter yield curves will continue. There is a case to be made that the U.S. Treasury yield curve could steepen further despite the Fed’s asset purchases as a result of the size of the U.S. budget deficit and the potential strength of the economic recovery. The U.S. budget deficit hit 19.7% of GDP on a one-year rolling basis by the end of March (Figure 7). By contrast, the Fed is purchasing bonds at a rate of $120 billion per month, which translates to $1.44 trillion per year or about 7% of GDP. In other words, net Treasury issuance exceeds the Fed’s buying by nearly a 3-1 ratio. The mismatch between Fed buying and Treasury issuance combined with what looks like an increasingly robust economic recovery has the potential to push long-term rates higher even as the Fed likely holds short-term rates low – in line with its guidance during the past year.
Figure 7: Treasury debt issuance exceeds Fed buying by a 3-1 margin so far in 2021.
Between 1990 and 2019, it appeared that a steep yield curve (or at least the easy monetary policy implied by a steep yield curve) was a prerequisite for reducing market volatility. Will that be the case this time around? One could argue that QE just by itself could supress realized and implied volatility in equity markets. Fed buying of U.S. Treasuries might reduce the volatility of long-term government bonds.
Moreover, the Fed is not just buying Treasuries. It also has purchased some mortgage, municipal and corporate bonds, the latter via exchange traded funds (ETFs). Each one of these bonds can be understood as being akin to a U.S. Treasury plus a short-put option on the risk of payment default. By buying such bonds, the Fed is indirectly writing insurance policies and potentially supressing the level of market volatility even as its QE policies likely lead to a flatter yield curve than we would normally have at this stage in the economic cycle.
The impact of the Fed’s actions can be seen most clearly in the corporate bond market. Even though the Fed has largely steered clear of buying high yield bonds (aside from a few “fallen angels” – bonds that were downgraded to high yield status in March 2020), the Fed’s buying of corporate bonds has had, by all appearances, a significant impact on the high yield bond market. High yield bond spreads over Treasuries are not below their pre-pandemic levels, they are even below their pre-global financial crisis levels, in sharp contrast with S&P 500 options, which have not yet returned pre-pandemic lows (Figure 8).
Figure 8: Credit spreads are now at their narrowest since before the global financial crisis
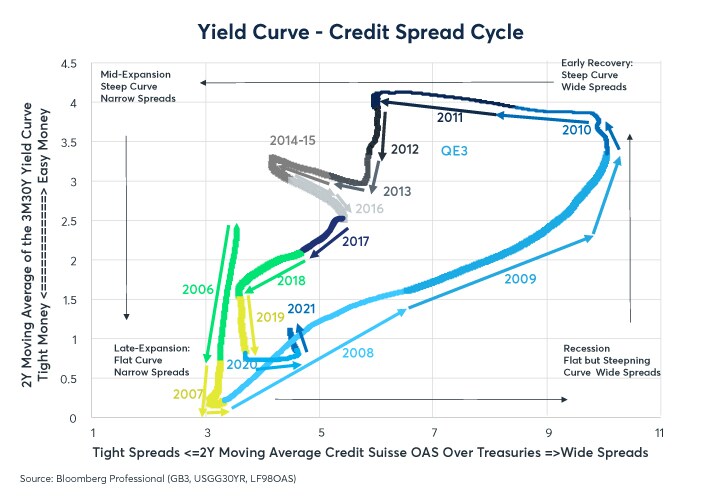
Between 1996 and 2019, high yield bond option adjusted spreads (OAS) followed a cycle with respect to the yield curve that looked a lot like the ones observed for options on the S&P 500 (Figure 9). However, in the case of corporate bonds, Fed QE buying of ETFs halted the widening of bond spreads in their tracks (Figure 10), essentially truncating the cycle and preventing bond spreads from achieving anything like the levels seen in past recessions.
Figure 9: Pre-2008 the credit spreads cycle looked like the one observed in equity index options
Figure 10: In 2020, Fed buying of corporate bond ETFs appeared to halt the widening of spreads
In a sense, the option embedded in corporate bonds and equity prices are two sides of the same coin. On one side of the coin is a short-put option that could cost the bond owner in the event of a default. On the other, is a long-call option (the equity value of a corporation) with a strike price of zero, an unlimited life and theoretically unlimited upside. Thus far in the Fed’s QE cycle, volatility has fallen for both the short-put and the long-call side of the equation, but it has fallen further and faster on the short put side than the long-call side where the Fed has been a direct buyer of corporate bonds via ETFs.
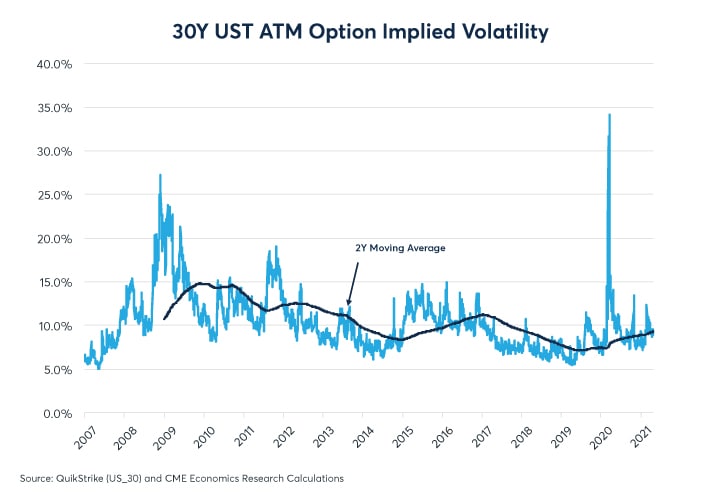
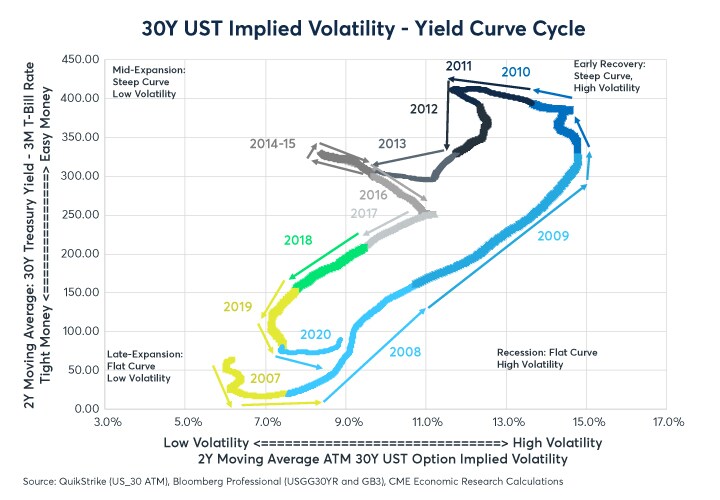
While the Fed has had great success in clamping down on high yield bond spreads and on implied volatility for shorter duration Treasuries, it has had less success in controlling the volatility of 30Y U.S. Treasury options (Figure 11). At that point on the curve, Treasury options appear to be following a cycle that is not too different from equity index options (Figure 12).
Figure 11: Like S&P 500® options, implied volatility on 30Y options remain above pre-pandemic levels
Figure 12: 30Y U.S. Treasury options are following a cycle that looks more like S&P 500® options
Bottom Line
- For the past 30 years, implied volatility and yield curves have been locked in a repeating cycle
- Have the Fed’s QE measures broken the implied volatility-yield curve cycle?
- As a result of central bank asset purchases, the yield curve has not steepened as it has in past cycles
- Fed buying of corporate bond ETFs may have played a role in narrowing credit spreads to pre-pandemic and even levels before the global financial crisis
- The Fed has been less successful containing volatility in 30Y bond options and U.S. equities
- The mismatch between Treasury debt issuance and Fed buying might steepen the yield curve further
- It is uncertain if the three-decade implied volatility-yield curve cycle remains intact
© 2025 Benzinga.com. Benzinga does not provide investment advice. All rights reserved.
Trade confidently with insights and alerts from analyst ratings, free reports and breaking news that affects the stocks you care about.

