BlackBerry LTD. BB shares are trading lower Thursday with earnings coming up scheduled to be released at the end of the day.
Sell-side analysts are expecting BlackBerry’s loss per share to be near 5 cents on sales of $171.25 million. In the same quarter last year, BlackBerry announced EPS of 2 cents on revenue of $214 million.
BlackBerry was down 2.6% at $12.80 at last check.

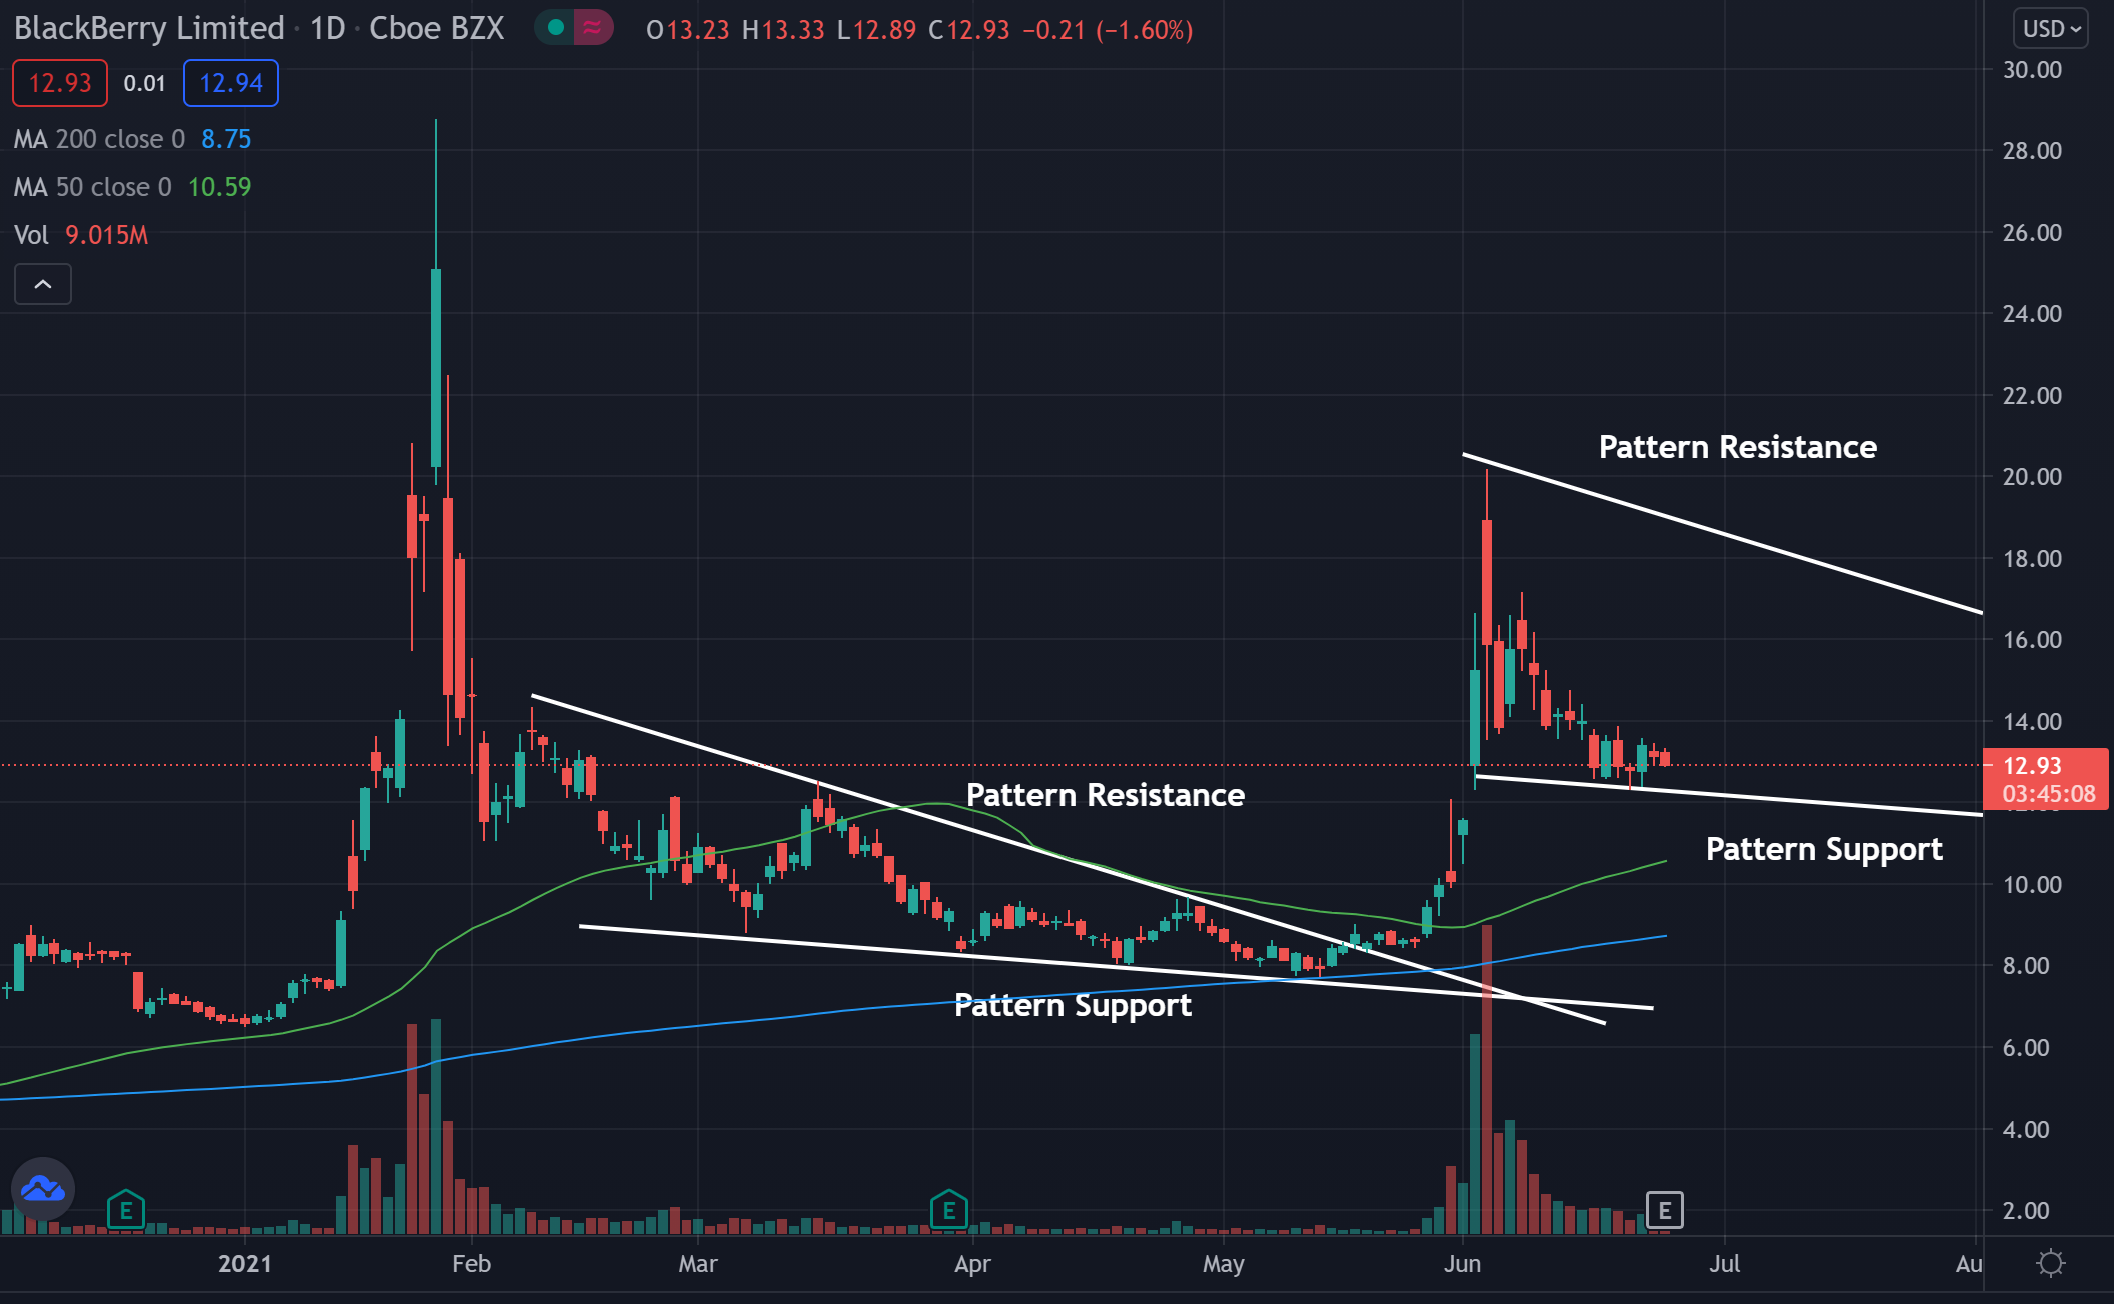
BlackBerry Daily Chart Analysis
- Shares traded in a falling wedge pattern before breaking out. Following the breakout, shares look to be forming into another falling wedge pattern.
- The stock is trading above both the 50-day moving average (green) and the 200-day moving average (blue), indicating sentiment in the stock is bullish.
- Each of these moving averages may hold as an area of support in the future.
Key BlackBerry Levels To Watch
- This bullish reversal pattern happens after the stock makes a large run up and starts pulling back. The slope of the line connecting the highs is much steeper than the line connecting the lows.
- The resistance and support lines in the second pattern are of the same angle as the lines in the first pattern. As stock moves tend to repeat themselves, the lines taken for the second pennant were copies of the support and resistance in the first pattern.
What’s Next For BlackBerry?
Bullish technical traders would like to see the stock trade within the pennant pattern for a time to help build up some momentum, and then see a break of pattern resistance similar to the first pennant breakout.
Bearish technical traders would like to see the stock fall below the pattern support. If the stock is able to fall below the pattern support and consolidate for a time, the stock may see a further downward push. Bears would also like to see the stock fall below the moving averages.
© 2025 Benzinga.com. Benzinga does not provide investment advice. All rights reserved.
Trade confidently with insights and alerts from analyst ratings, free reports and breaking news that affects the stocks you care about.