The following post was written and/or published as a collaboration between Benzinga’s in-house sponsored content team and a financial partner of Benzinga.
EUR/USD Current Price: 1.1891
- US Gross Domestic Product printed at 6.5% in the second quarter.
- The EU Economic Sentiment Indicator improved to 119 in July from 117.9.
- EUR/USD pressures daily highs and could keep rallying towards 1.1920.
The EUR/USD pair traded as high as 1.1892 on Thursday, ending the day not far below. The American dollar accelerated its post-Fed slump after another round of dismal US data. The country published the preliminary estimate of its Q2 Gross Domestic Product, which showed the economy grew at an annualized pace of 6.5%, better than the previous 6.4%, although missing the 8.6% expected. Also, Initial Jobless Claims for the week ended July 23 printed at 400K, worse than anticipated. Meanwhile, Wall Street rallied, with stocks´ traders relieved after the Fed’s patient stance on tapering.
Germany published the preliminary estimates of July inflation. The annual Consumer Price Index jumped to 3.8%, well above the 3.3% expected. The EU released the July Economic Sentiment Indicator, which improved to 119 from 117.9. On Friday, Germany will publish the preliminary estimate of Q2 GDP, foreseen at 2% from -1.8% in Q1, while the EU will also publish its Q2 GDP, foreseen at 1.5% from -0.3% previously. Finally, the US will unveil June Personal Income and Personal Spending figures, including core PCE inflation.
EUR/USD short-term technical outlook
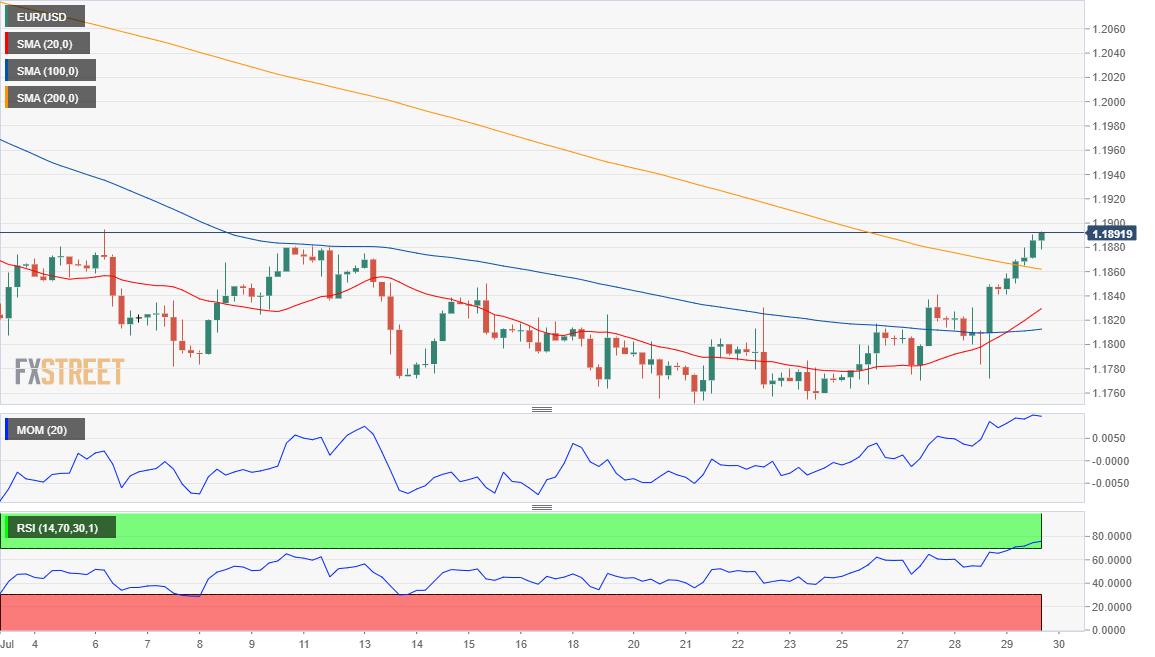
The EUR/USD pair trades around the mentioned high and is poised to keep advancing. The main bullish target and the immediate resistance level is 1.1920, the 61.8% retracement of the March/May rally. The 4-hour chart shows that the pair is developing above all of its moving averages, with the 20 SMA crossing above the 100 SMA, reflecting increased buying interest. Technical indicators lost their upward strength after reaching overbought conditions, but with the RSI consolidating around 70, chances of a near-term decline are limited.
Support levels: 1.1840 1.1790 1.1750
Resistance levels: 1.1920 1.1960 1.2000
Image Sourced from Pixabay
The preceding post was written and/or published as a collaboration between Benzinga’s in-house sponsored content team and a financial partner of Benzinga. Although the piece is not and should not be construed as editorial content, the sponsored content team works to ensure that any and all information contained within is true and accurate to the best of their knowledge and research. This content is for informational purposes only and not intended to be investing advice.
© 2025 Benzinga.com. Benzinga does not provide investment advice. All rights reserved.
Trade confidently with insights and alerts from analyst ratings, free reports and breaking news that affects the stocks you care about.
