The following post was written and/or published as a collaboration between Benzinga’s in-house sponsored content team and a financial partner of Benzinga.
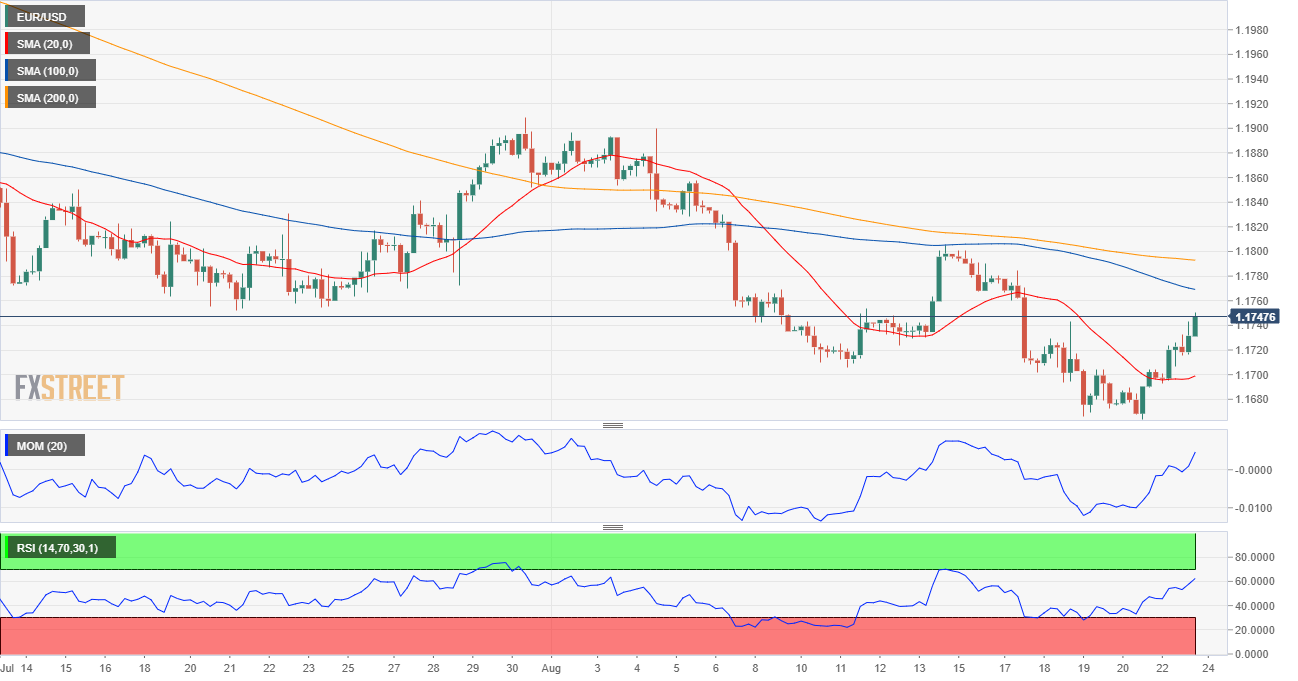
EUR/USD Current Price: 1.1747
- August Markit PMIs indicated a slower pace of recovery in the EU.
- Market players are more optimistic amid speculation of persistent financial support.
- EUR/USD could extend its advance once above 1.1750, the immediate resistance level.
The EUR/USD pair reached an intraday high of 1.1747, suffering a minor setback during US trading hours but ending the day with gains in the 1.1740 price zone. The pair advanced despite European data mixed expectations. Markit published the preliminary estimates of its August PMIs for the EU, which showed that business activity in the area continued to grow, although the rate of expansion has slightly cooled. The Services PMI printed at 59.7, while the manufacturing index resulted in 61.5, both missing expectations.
Across the pond, the US published Existing Home Sales, which rose in July by 2%, up for a second month, indicating firmer housing demand as inventory constraints showed signs of easing. However, the preliminary estimates of the August Markit PMIs weighed on the dollar, as the Services PMI printed at 55.2, while the Manufacturing PMI came in at 61.2, both below expected and contracting from the final July figures.
On Tuesday, Germany will publish a revision of its Q2 Gross Domestic Product, foreseen unchanged at 1.5% QoQ, while the US will release July New Home Sales.
EUR/USD short-term technical outlook
The EUR/USD pair is bullish in the near term, although its upward potential is limited as long as it stands below 1.1750, the immediate resistance level. The 4-hour chart shows that the pair has stabilized above a mildly bullish 20 SMA, but also that it holds below bearish longer ones. Technical indicators remain within positive levels, but the Momentum is retreating while the RSI is flat around 59, indicating receding buying interest.
Support levels: 1.1700 1.1660 1.1620
Resistance levels: 1.1750 1.1790 1.1820
Image Sourced from Pixabay
The preceding post was written and/or published as a collaboration between Benzinga’s in-house sponsored content team and a financial partner of Benzinga. Although the piece is not and should not be construed as editorial content, the sponsored content team works to ensure that any and all information contained within is true and accurate to the best of their knowledge and research. This content is for informational purposes only and not intended to be investing advice.
© 2025 Benzinga.com. Benzinga does not provide investment advice. All rights reserved.
Trade confidently with insights and alerts from analyst ratings, free reports and breaking news that affects the stocks you care about.
