C3.ai Inc. AI shares were trading higher Wednesday, with the company scheduled to report second-quarter financial results after the closing bell.
The company is expected to report a quarterly loss at 28 cents per share with revenue of $51.16 million.
C3.ai was up 2.89% at $53.03 at last check.
C3.ai Daily Chart Analysis
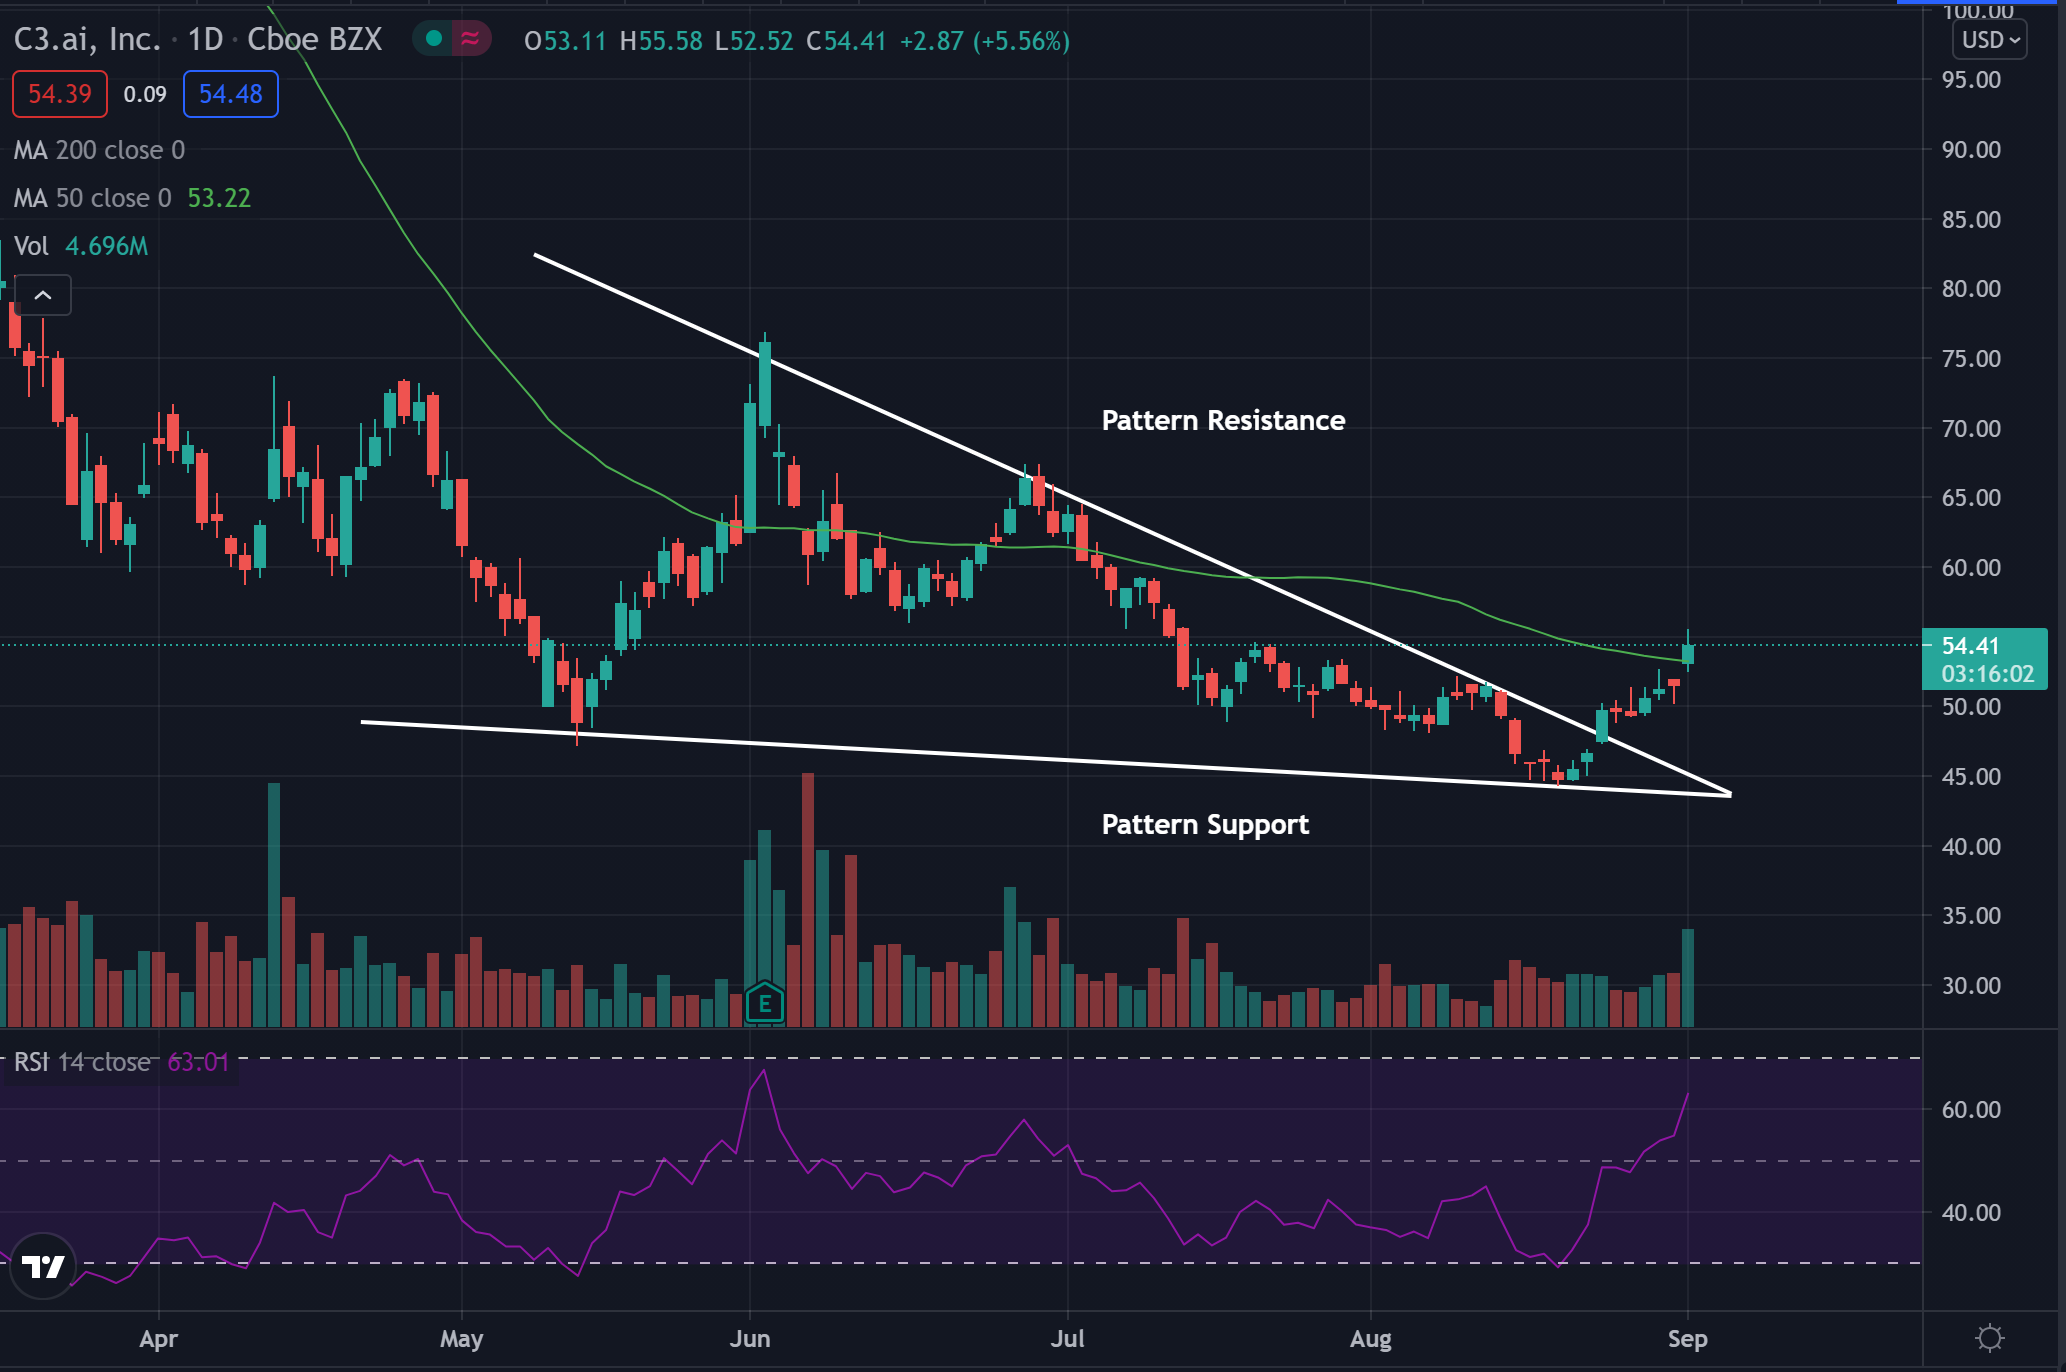
- Shares were falling in recent months and look to possibly be breaking out of what technical traders call a falling wedge pattern. It's a sign the stock may be attempting to reverse.
- The stock recently broke above pattern resistance and has been able to move higher since, potentially signaling a breakout and a hint that a trend change may be coming.
- The stock crossed above the 50-day moving average (green) Wednesday, showing that resistance may be turning more bullish.
- The 50-day moving average may hold as a possible area of support in the future.
- The Relative Strength Index (RSI) has been moving higher in the last few weeks and now sits at the 64 level. The move higher shows there have been more buyers pushing into the stock.

What’s Next For C3.ai?
Bullish traders would like to see the stock continue to move higher above pattern resistance. Bulls would then like to see the stock have a period of consolidation where the stock can hold the gains it has made.
Bears would like to see the stock drop back into the pennant pattern and start heading back toward support. If the stock could fall back down and drop below pattern support, it may be ready to see a further downward push.
© 2025 Benzinga.com. Benzinga does not provide investment advice. All rights reserved.
Trade confidently with insights and alerts from analyst ratings, free reports and breaking news that affects the stocks you care about.