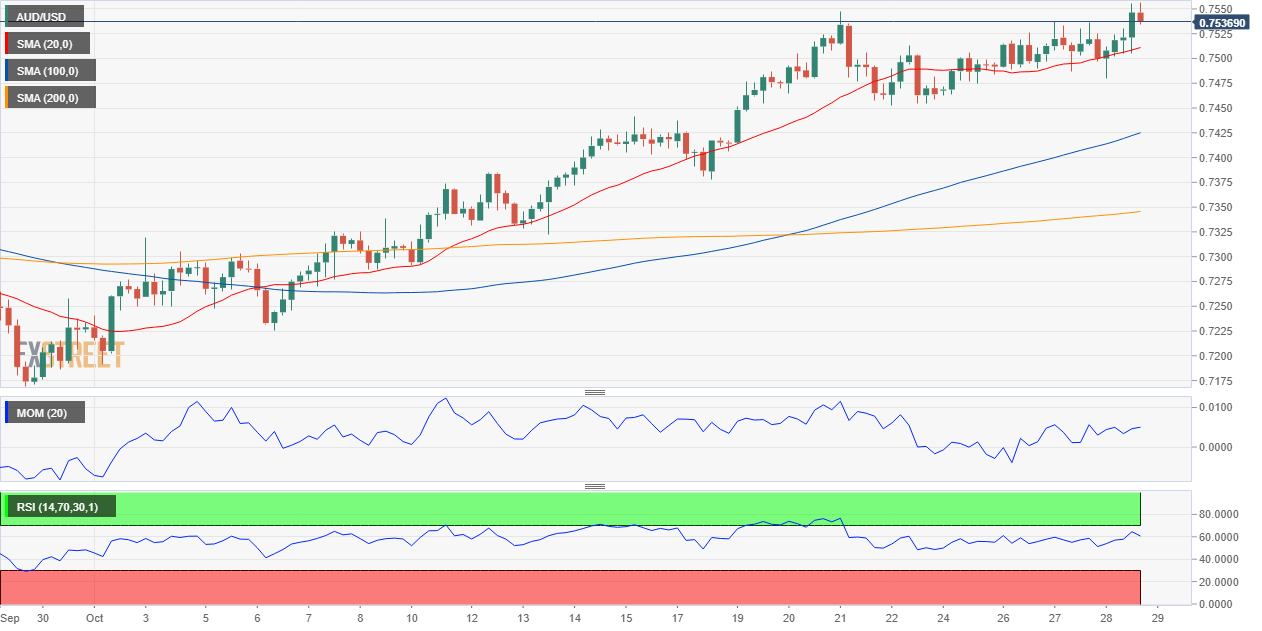
AUD/USD Current Price: 0.7536
- Australian Retail Sales are expected to have recovered after plummeting in August.
- US growth decelerated in the third quarter of the year, missing expectations.
- AUD/USD trades at fresh multi-month highs and is likely to extend its advance.
The AUD/USD pair reached an intraday high of 0.7555, a level that was last seen on July 6. The pair holds nearby heading into the Asian opening, as the greenback retains its broad weakness. AUD/USD bottomed at 0.7479 weighed at the beginning of the day by the sour tone of global equities. Following the poor performance of Wall Street, Asian shared fell, providing mild support to the American currency.
Equities changed course during US trading hours, as dismal growth figures cooled expectations of an aggressive tapering from the US Federal Reserve. The country grew a modest 2% in the third quarter of the year, well below the previous 6.7%. The greenback fell into a selling spiral, while equities trimmed weekly losses.
Earlier in the day, Australia published the Q3 Import Price Index, which resulted at 5.4%, much better than the 0.6% expected. The Export Price Index in the same period came in at 6.2%, also beating expectations. The country will release September Retail Sales, foreseen at 0.2% after printing -1.7% in the previous month, and the Q3 Producer Price Index, expected at 0.3% QoQ.
AUD/USD short-term technical outlook
The AUD/USD pair closed a fourth consecutive day with gains and could keep gaining ground, according to technical readings. The daily chart shows that the pair has extended its advance beyond its 20 and 100 SMAs, with the shorter one crossing above the longer one. The 200 SMA provided intraday resistance at 0.7555, while technical indicators extended their advances near overbought readings.
The 4-hour chart shows that the pair is developing above a bullish 20 SMA, while the longer ones head north well below the current level. Technical indicators hold within positive levels but have lost momentum. Nevertheless, a break through the daily high should lead to a steeper advance to fresh highs beyond the 0.7600 level.
Support levels: 0.7520 0.7490 0.7450
Resistance levels: 0.7555 0.7590 0.7625
Image Sourced from Pixabay
© 2025 Benzinga.com. Benzinga does not provide investment advice. All rights reserved.
Trade confidently with insights and alerts from analyst ratings, free reports and breaking news that affects the stocks you care about.
