Alibaba Group Ltd.. BABA shares were trading lower Thursday after the Chinese e-commerce company reported worse-than-expected quarterly financial results. Alibaba reported quarterly non-GAAP diluted earnings per ADS of $1.74, missing the analyst estimate of $1.93.
Alibaba was down 9.33% at $146.51 midday Thursday.
Alibaba Daily Chart Analysis
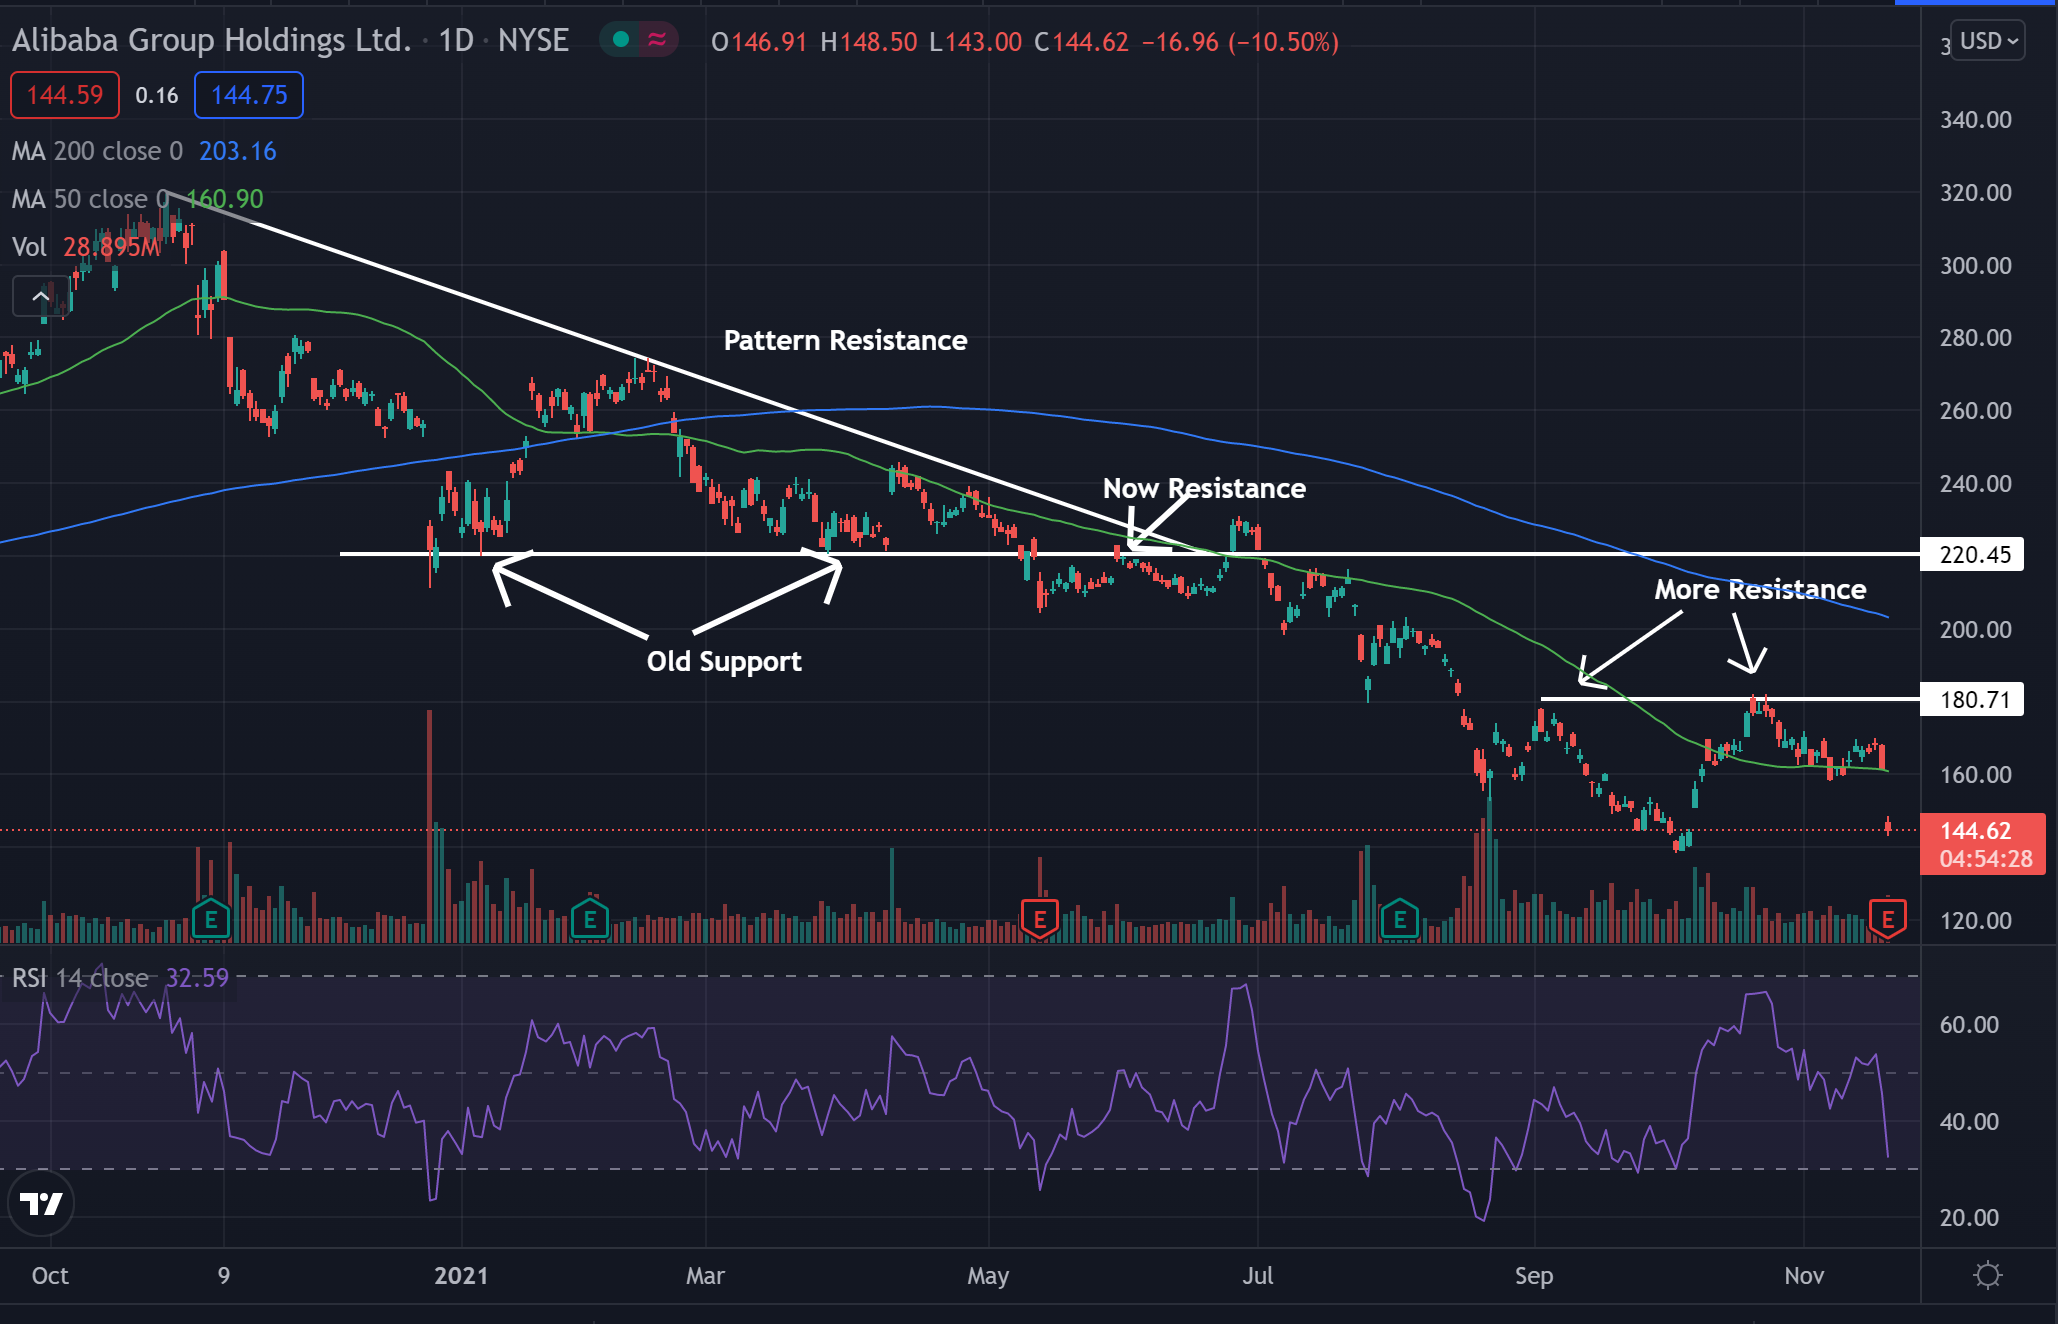
- The stock fell below what technical traders call a descending triangle pattern and have been falling lower since and creating new areas of resistance.
- The $220 level was an area where resistance had previously been found and the stock kept pushing lower. Later, the stock went on to create more resistance lines, and the $180 level is also now holding as a resistance area.
- The stock trades below both the 50-day moving average (green) and the 200-day moving average (blue), indicating the stock’s sentiment has been bearish.
- Each of these moving averages may hold as an area of resistance in the future.
- The Relative Strength Index (RSI) took a strong dip lower Thursday and now sits at 32. This nears the oversold area where the stock may see many more sellers than buyers.
See Also: Why Alibaba Shares Are Falling Today

What’s Next For Alibaba?
Bullish traders are looking for the stock to find some support and make a bounce. If the stock can bounce, these bulls would then like to see the stock begin to form higher lows and start heading back higher toward the resistance levels.
Bears have been in control of the stock for a while and would like to see the stock continue to fall. Bears are also looking to see the RSI stay low and for the stock to stay below the moving averages for sentiment to stay bearish.
© 2024 Benzinga.com. Benzinga does not provide investment advice. All rights reserved.
Comments
Trade confidently with insights and alerts from analyst ratings, free reports and breaking news that affects the stocks you care about.